This topic walks you through the essential steps to set up OpsRamp in your environment and begin monitoring your infrastructure. Whether you are a platform administrator, operator, or implementation engineer, this is your first stop for onboarding.
By completing this topic, you will:
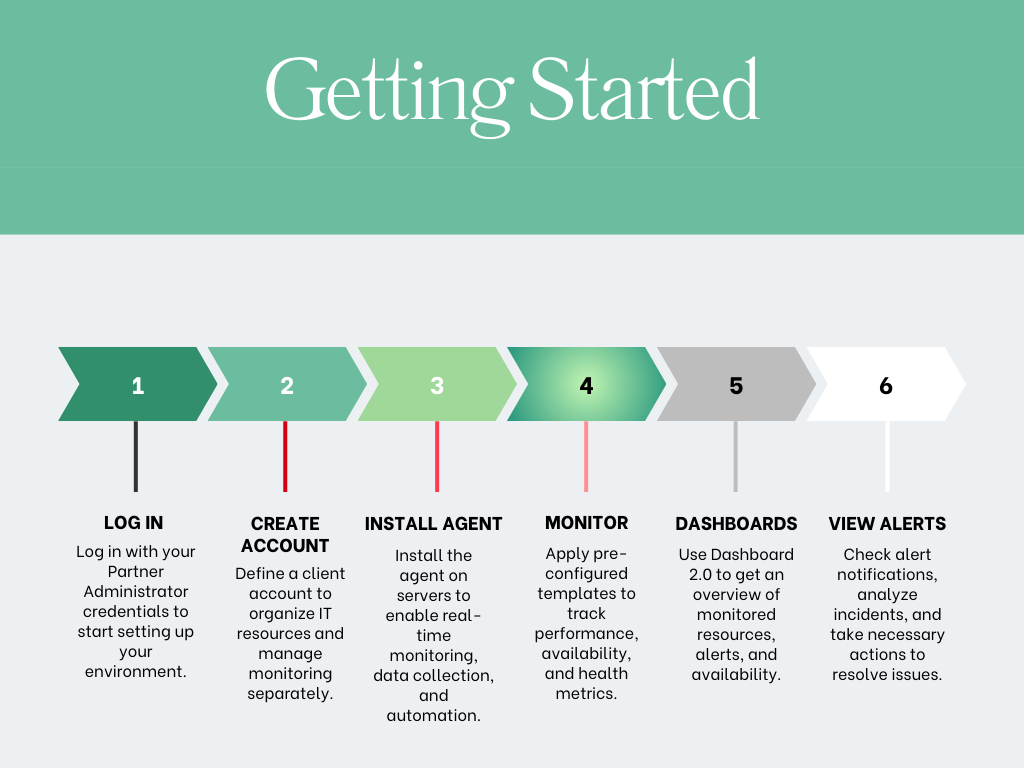
- Access your OpsRamp instance
- Create a tenant (client) account
- Install and verify the OpsRamp Agent
- Apply monitoring templates
- Visualize dashboards and validate alert generation
Looking for a high-level overview of OpsRamp features and navigation?
Start with Start Your OpsRamp Journey
Note
Prerequisite: You must have a provisioned OpsRamp account and Partner Administrator credentials.This guide assumes you have basic knowledge of IT infrastructure concepts and access to the OpsRamp platform as a Partner Administrator.
1. Log into the OpsRamp Platform
Direct Login (Standalone)
- Open your browser and go to:
https://{your-org}.app.opsramp.com - Enter your credentials and log in as a Partner Administrator.
- You will be directed to the OpsRamp console.
Via HPE GreenLake
- Sign in to the HPE GreenLake portal.
- Click on the OpsRamp tile.
- You will be redirected to your provisioned OpsRamp environment.
Tip
Ensure firewall rules allow HTTPS access to the OpsRamp domain. Use supported browsers like Chrome, Firefox, or Edge.2. Create a Client Account
OpsRamp uses a multi-tenant model. Each logical business unit, department, or customer (for MSPs) should be mapped as a client account.
- Navigate to: Setup → Accounts → Clients
- Click + Add and fill in the following fields:
| Field | Description |
|---|---|
| Client Name | Display name of the tenant organization or unit. |
| Address | Main office address (for reports and metadata). |
| Country | Used for localization and compliance settings. |
| Time Zone | Ensures timestamps in alerts, reports, and dashboards are accurate. |
- Set Auto Monitoring Resources to No to configure monitors manually.
- Click Next, then Finish.
The Client Details page opens with further configuration options.
3. Install the OpsRamp Agent
The OpsRamp Agent is a lightweight software component installed on your target systems to enable data collection, remote actions, and availability monitoring.
OpsRamp Agent Capabilities:
- Collects metrics, logs, and alerts
- Executes remediation workflows
- Enables secure communication with OpsRamp
To install the agent:
- Go to: Setup → Account → Integrations
- Select your OS:
- Copy the provided installation command (auto-generated for your client + org ID).
- Log in to the server and run the command with root/admin rights.
Start with installing the Agent on a few critical servers you want to monitor. You can add more resources later.
Verify Agent Status:
- Navigate to: Infrastructure → Resources → Servers
- Locate your resource by name or IP.
The status may initially show Undefined until a monitoring template is applied.
4. Apply Monitoring Templates
Monitoring templates define the metrics, thresholds, and collection intervals for different types of infrastructure.
Assign a Monitoring Template:
- Go to: Setup → Monitoring → Templates
- Use the filter/search bar to find a template (e.g., Windows Server, MySQL, Apache).
- Click the template and choose Assign.
- Select the client and target resources.
- Click Submit.
You can also create custom templates for specialized monitoring use cases.
5. View Dashboards
Dashboards help visualize real-time performance data and alerts across your infrastructure.
View the Default Dashboard:
- Navigate to: Dashboards → Dashboards 2.0
- Select the default dashboard. You will see:
- Resource availability
- CPU and memory trends
- Top alerts by severity
- Resource inventory breakdown
Customize Your Dashboard:
- Click + Add Dashboard
- Add widgets such as:
- Metric graphs
- Top N alerts
- Resource availability by site
- Save and share with specific roles or accounts.
6. Generate and Review Alerts
Simulating an alert helps verify whether the platform detects and processes real-time issues.
Simulate an Alert:
- Power off a server with the OpsRamp Agent installed.
- Wait ~5 minutes.
- Go to: Command Center → Alerts
- Search or filter by resource or client.
You should see a Critical alert titledOpsRamp Agent is Offline.
Clear the Alert:
- Power the server back on.
- The alert should auto-resolve and change from Critical → OK.
Alerts are retained for historical review and post-incident analysis.
Frequently Asked Questions
Why is my server status showing “Undefined” after installing the agent?
This usually means a monitoring template has not been applied yet. Assign one to the server to enable proper data collection.
Do I need to install the agent on all servers?
Start with a few key servers. You can scale out later using automation or deployment tools.
How do I add users under a client account?
Go to Setup → Accounts → Users. See the User and Role Management Guide for detailed steps.
Can I customize which alerts I receive?
Yes. Once monitoring is active, you can configure Alert Escalation Policies and thresholds.
What’s Next?
Now that your instance is up and running, you can:
- Explore Alert Policies and Escalations
- Learn how to Group and Tag Resources
- Review User and Role Setup
- Discover Integrations
- Expand with Automated Remediation Workflows