Prometheus is an open-source software application used for event monitoring and alerting.
Validated Version: Prometheus 2.14.0
OpsRamp configuration
Step 1: Install integration
- From All Clients, select a client.
- Navigate to Setup > Account.
- Select the Integrations and Apps tab.
- The Installed Integrations page, where all the installed applications are displayed. Note: If there are no installed applications, it will navigate to the Available Integrations and Apps page.
- Click + ADD on the Installed Integrations page. The Available Integrations and Apps page displays all the available applications along with the newly created application with the version.
- Search for the application using the search option available. Alternatively, use the All Categories option to search.
- Click ADD on the Prometheus tile.
Inbound (Optional):
To configure the inbound, follow these steps:
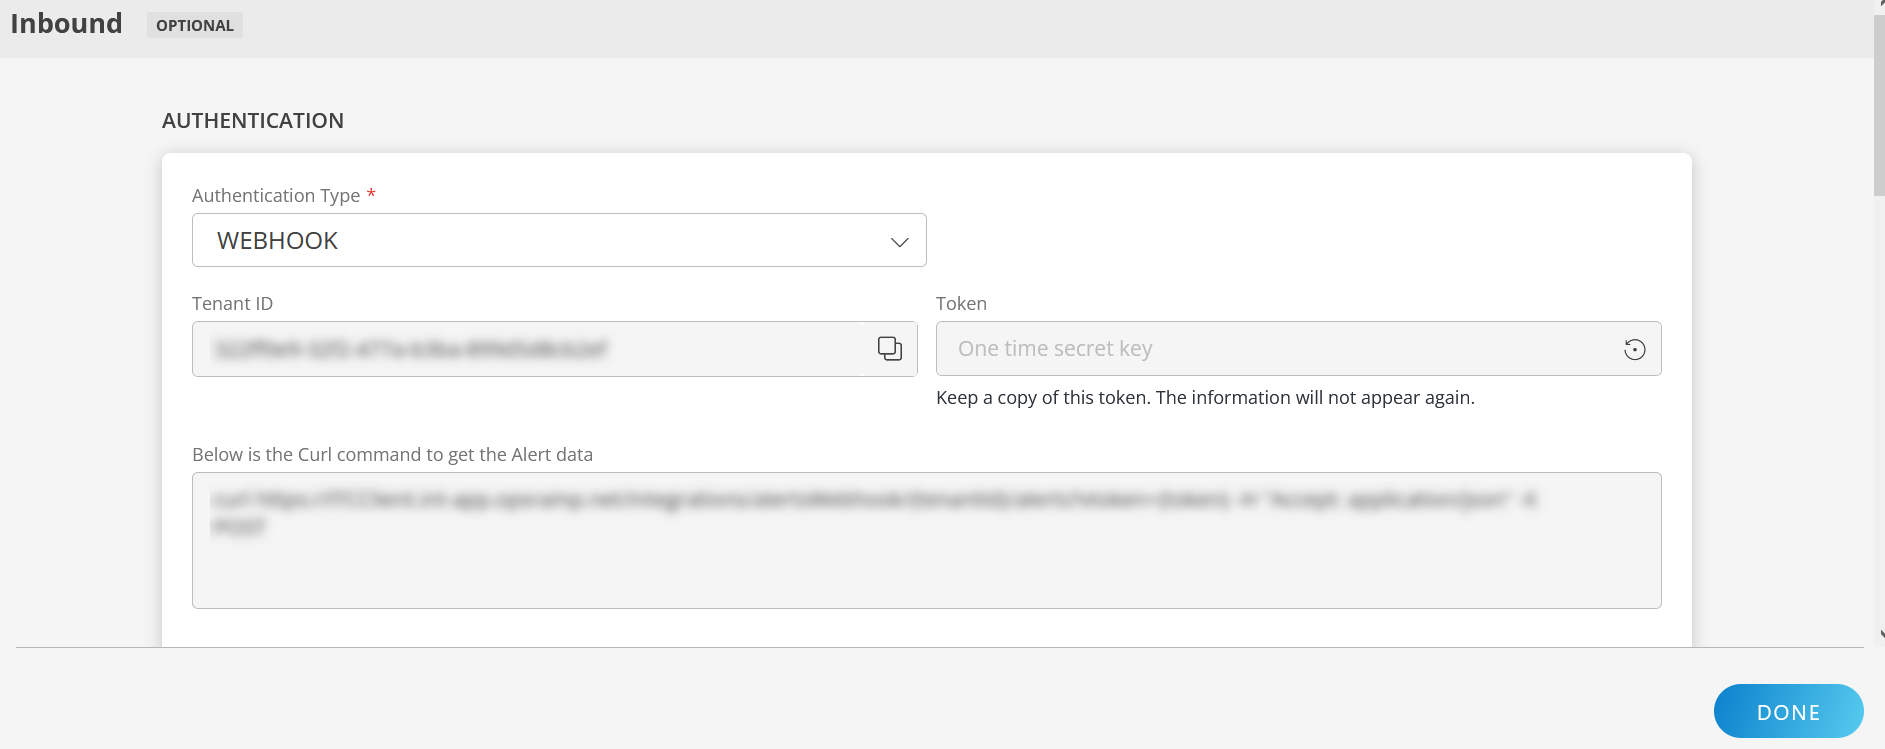
Authentication:
Select the Authentication Type as Webhook.
- Webhook: By default, Webhook is selected as the Authentication Type.
Make a note of Tenant ID, Token and Webhook URL.
These details are used while creating an HTTP Request template during Prometheus configuration.
- Webhook: By default, Webhook is selected as the Authentication Type.
Map Attributes: Map OpsRamp entity attributes with Prometheus attributes.
Click +Add from the Map Attributes section.
From the Add Map Attributes window, enter the below information:
- OpsRamp Entity: Select Alert from the dropdown.
- OpsRamp Property: Select the OpsRamp property from the dropdown.
- Prometheus Entity: Enter the Prometheus entity value in the box and click the +value from the dropdown to add it. You can add multiple values.
- Prometheus Property: Enter the Prometheus property.
Parsing Condition:
- Click +Add and provide the parsing condition:
- Select an operator from the dropdown and enter a value in the fields accordingly. Based on the operator selected, the fields vary.
- Click Save. Click +Add to add more conditions.
Property Values:
- Click +Property Value.
- Enter a value in the Prometheus Property Value box and select the appropriate value from the OpsRamp Property Value dropdown.
The options in the OpsRamp Property Value dropdown appear based on the OpsRamp Property selected. - Click Save.
- Click +Property Value to add more property values.
Default Value: Alternatively, you can enter/select a default value in the box.
Note: To map more attributes, click +Entity.
Click Add Map Attributes. The mapped attributes list is added.
- Click the three dots icon at the end of each row to edit or remove the map attributes.
- Use the Filter option to filter the map attributes.
Additional Settings: Select the Drop alerts from unmanaged resources checkbox if you do not want to trigger alerts from unmanaged resources.
Enrich and Create Alert: Select a process definition from the dropdown. You can customize the incoming alerts according to the properties defined in the process definition.
Click Finish.
Attributes can be modified at any time.
The following table shows attribute mappings:
| Third-Party Entity | OpsRamp Entity | Third-Party Property | OpsRamp Property | Third-Party Property Value | OpsRamp Property Value |
|---|---|---|---|---|---|
| Event | Alert | alerts.labels.severity | alert.currentState | critical | Critical |
| warning | Warning | ||||
| Event | Alert | alerts.labels.alertname | alert.serviceName | ||
| Event | Alert | alerts.annotations.description | alert.description | ||
| Event | Alert | alerts.generatorURL | alert.deviceName | ||
| Event | Alert | alerts.startsAt | alert.alertTime | ||
| Event | Alert | alerts.annotations.summary | alert.subject |
The following mappings examples are based on a custom label and values and reflect the Prometheus Alert Browse configuration examples.
- severity: critical
- metric: container_memory_usage_bytes
- Description: testing alert1
- annotations
- summary: High Memory Usage
Prometheus configuration
Routing the Prometheus alerts to OpsRamp is configured using the YAML definition used during deployment. Based on the requirement, you can configure Prometheus using either of the following scenarios:
- Configure without defining a label for the app and forward all generated alerts of Prometheus to OpsRamp.
- Configure with a label defined for the app and forward selective generated alerts to OpsRamp.
Configuring without defining App label
Configuration without defining the App label involves configuring only Prometheus Alert Manager. OpsRamp webhook becomes the default receiver in the Alert Manager configuration. A label is not defined and all alerts with a severity level of error/warning that Prometheus generates are forwarded to OpsRamp. As a result, configuring alert rules is not required.
Configure Prometheus Alert Manager
Alert Manager is the receiver to route the alerts.
To configure Alerts in Prometheus:
- Get the Webhook URL from the OpsRamp configuration.
- Use the Webhook URL in the Prometheus Alert Manager configuration to map the YAML file:
{
receivers:

- name: opsramp-webhook
   webhook_configs:
  - url: https://<apiserver>/integrations/alertsWebhook/client_123/alerts?vtoken=<token>
      send_resolved: true
route:
  group_by:
  - alertname
  group_interval: 1m
  group_wait: 30s
  receiver: opsramp-webhook
  repeat_interval: 2m
  routes:
  - receiver: opsramp-webhook
    match_re:
      severity: error|warning
}
Configuring with App label defined
With the App label defined only selective alerts are forwarded from Prometheus to OpsRamp.
Step 1: Configure Prometheus Alert Manager
Alert Manager is the receiver to route the alerts.
To configure Alerts in Prometheus:
- Get the Webhook URL from the OpsRamp configuration.
- Use the following Webhook URL in the Prometheus Alert Manager configuration to map the YAML file:
For a standalone Prometheus Alert Manager server, this configuration YAML file is located at the /etc/alertmanager folder.
kind: ConfigMap

apiVersion: v1

metadata:
    name: alertmanager-config
    namespace: monitoring
    data:
      config.yml:

global:

templates:
- '/etc/alertmanager/*.tmpl'

receivers:
    - name: default-receiver
    - name: opsramp-webhook
      webhook_configs:
        - url: "<<https://<webhook_url>/integrations/alertsWebhook/client_14/alerts?vtoken>>=<TokenValue>"

route:
  group_wait: 10s
  group_interval: 5m
  receiver: default-receiver
  repeat_interval: 3h

routes:

- receiver: opsramp-webhook
  match_re:
  app: opsramp
Step 2: Configure alert rules
This step configures the alert rules in the Prometheus Alert Manager. Filtering rules are created by using Alerting profiles. The alert rules are labeled as OpsRamp alerts for the receiver.
To configure alert rules, add the required labels in the prometheus.rules file, config map for alert rules, to map the alerts generated from these rules to the corresponding OpsRamp entities in the OpsRamp alert browser:
YAML file
    apiVersion: v1
    kind: ConfigMap
    metadata:
      name: prometheus-server-conf
      labels:
        name: prometheus-server-conf
      namespace: monitoring
    data:
      prometheus.rules: |-
        groups:
        - name: devopscube demo alert
          rules:
          - alert: High Pod Memory
            expr: sum(container_memory_usage_bytes) > 1
            for: 1m
            **labels:**
     **severity: critical**
     **app: opsramp**
     **metric: container_memory_usage_bytes**
     **Description: testing alert1**
            annotations:
              **summary: High Memory Usage**
        - name: devopscude demo alert2
          rules:
          - alert: High Pod Memory2
            expr: sum(container_memory_usage_bytes) > 2
            for: 1m
           ** labels:**
     **severity: VeryCritical**
     **app: opsramp**
     **metric: container_memory_usage_bytes**
     **Description: testing alert2**
            annotations:
              **summary: High Memory Usage2**
      prometheus.yml: |-
        global:
          scrape_interval: 5s
          evaluation_interval: 5s
        rule_files:
          - /etc/prometheus/prometheus.rules
        alerting:
          alertmanagers:
          - scheme: http
            static_configs:
            - targets:
              - "alertmanager.monitoring.svc:9093"
        scrape_configs:
          - job_name: 'kubernetes-apiservers'

            kubernetes_sd_configs:
            - role: endpoints
            scheme: https

            tls_config:
              ca_file: /var/run/secrets/kubernetes.io/serviceaccount/ca.crt
            bearer_token_file: /var/run/secrets/kubernetes.io/serviceaccount/token

            relabel_configs:
            - source_labels: [__meta_kubernetes_namespace, __meta_kubernetes_service_name, __meta_kubernetes_endpoint_port_name]
              action: keep
              regex: default;kubernetes;https

          - job_name: 'kubernetes-nodes'

            scheme: https

            tls_config:
              ca_file: /var/run/secrets/kubernetes.io/serviceaccount/ca.crt
            bearer_token_file: /var/run/secrets/kubernetes.io/serviceaccount/token

            kubernetes_sd_configs:
            - role: node

            relabel_configs:
            - action: labelmap
              regex: __meta_kubernetes_node_label_(.+)
            - target_label: __address__
              replacement: kubernetes.default.svc:443
            - source_labels: [__meta_kubernetes_node_name]
              regex: (.+)
              target_label: __metrics_path__
              replacement: /api/v1/nodes/${1}/proxy/metrics

          - job_name: 'kubernetes-pods'
            kubernetes_sd_configs:
            - role: pod

            relabel_configs:
            - source_labels: [__meta_kubernetes_pod_annotation_prometheus_io_scrape]
              action: keep
              regex: true
            - source_labels: [__meta_kubernetes_pod_annotation_prometheus_io_path]
              action: replace
              target_label: __metrics_path__
              regex: (.+)
            - source_labels: [__address__, __meta_kubernetes_pod_annotation_prometheus_io_port]
              action: replace
              regex: ([^:]+)(?::d+)?;(d+)
              replacement: $1:$2
              target_label: __address__
            - action: labelmap
              regex: __meta_kubernetes_pod_label_(.+)
            - source_labels: [__meta_kubernetes_namespace]
              action: replace
              target_label: kubernetes_namespace
            - source_labels: [__meta_kubernetes_pod_name]
              action: replace
              target_label: kubernetes_pod_name

          - job_name: 'kubernetes-cadvisor'

            scheme: https

            tls_config:
              ca_file: /var/run/secrets/kubernetes.io/serviceaccount/ca.crt
            bearer_token_file: /var/run/secrets/kubernetes.io/serviceaccount/token

            kubernetes_sd_configs:
            - role: node

            relabel_configs:
            - action: labelmap
              regex: __meta_kubernetes_node_label_(.+)
            - target_label: __address__
              replacement: kubernetes.default.svc:443
            - source_labels: [__meta_kubernetes_node_name]
              regex: (.+)
              target_label: __metrics_path__
              replacement: /api/v1/nodes/${1}/proxy/metrics/cadvisor

          - job_name: 'kubernetes-service-endpoints'

            kubernetes_sd_configs:
            - role: endpoints

            relabel_configs:
            - source_labels: [__meta_kubernetes_service_annotation_prometheus_io_scrape]
              action: keep
              regex: true
            - source_labels: [__meta_kubernetes_service_annotation_prometheus_io_scheme]
              action: replace
              target_label: __scheme__
              regex: (https?)
            - source_labels: [__meta_kubernetes_service_annotation_prometheus_io_path]
              action: replace
              target_label: __metrics_path__
              regex: (.+)
            - source_labels: [__address__, __meta_kubernetes_service_annotation_prometheus_io_port]
              action: replace
              target_label: __address__
              regex: ([^:]+)(?::d+)?;(d+)
              replacement: $1:$2
            - action: labelmap
              regex: __meta_kubernetes_service_label_(.+)
            - source_labels: [__meta_kubernetes_namespace]
              action: replace
              target_label: kubernetes_namespace
            - source_labels: [__meta_kubernetes_service_name]
              action: replace
target_label: kubernetes_name- For the standalone Prometheus server, this configuration file is located at the
/etc/prometheus/prometheus.rulesfolder. - The terminology used in the severity label is used for corresponding critical/warning/ok alerts at OpsRamp and you need to configure the same at OpsRamp for the Prometheus integration.
Example payload
{
  "receiver": "opsramp-webhook",
  "status": "firing",
  "alerts": [
    {
      "status": "firing",
      "labels": {
        "alertname": "HighRAMUsage",
        "severity": "critical"
      },
      "annotations": {
        "description": "High RAM usage on 192.168.64.19:9100 is greater than 60%.",
        "summary": "High RAM usage on 192.168.64.19:9100"
      },
      "startsAt": "2024-02-22T12:15:27.837Z",
      "endsAt": "0001-01-01T00:00:00Z",
      "generatorURL": "http://prometheus:9090/graph?g0.expr=100+-+%28avg%28rate%28node_RAM_seconds_total%7Bmode%3D%22idle%22%7D%5B5m%5D%29%29+%2A+100%29+%3E+60&g0.tab=1",
      "fingerprint": "186cf1c392504be9"
    }
  ],
  "groupLabels": {
    "alertname": "HighRAMUsage"
  },
  "commonLabels": {
    "alertname": "HighRAMUsage",
    "severity": "critical"
  },
  "commonAnnotations": {
    "description": "High RAM usage on 192.168.64.19:9100 is greater than 60%.",
    "summary": "High RAM usage on 192.168.64.19:9100"
  },
  "externalURL": "http://prometheus:9093",
  "version": "4",
  "groupKey": "{}:{alertname=\"HighRAMUsage\"}",
  "truncatedAlerts": 0
}
Next steps
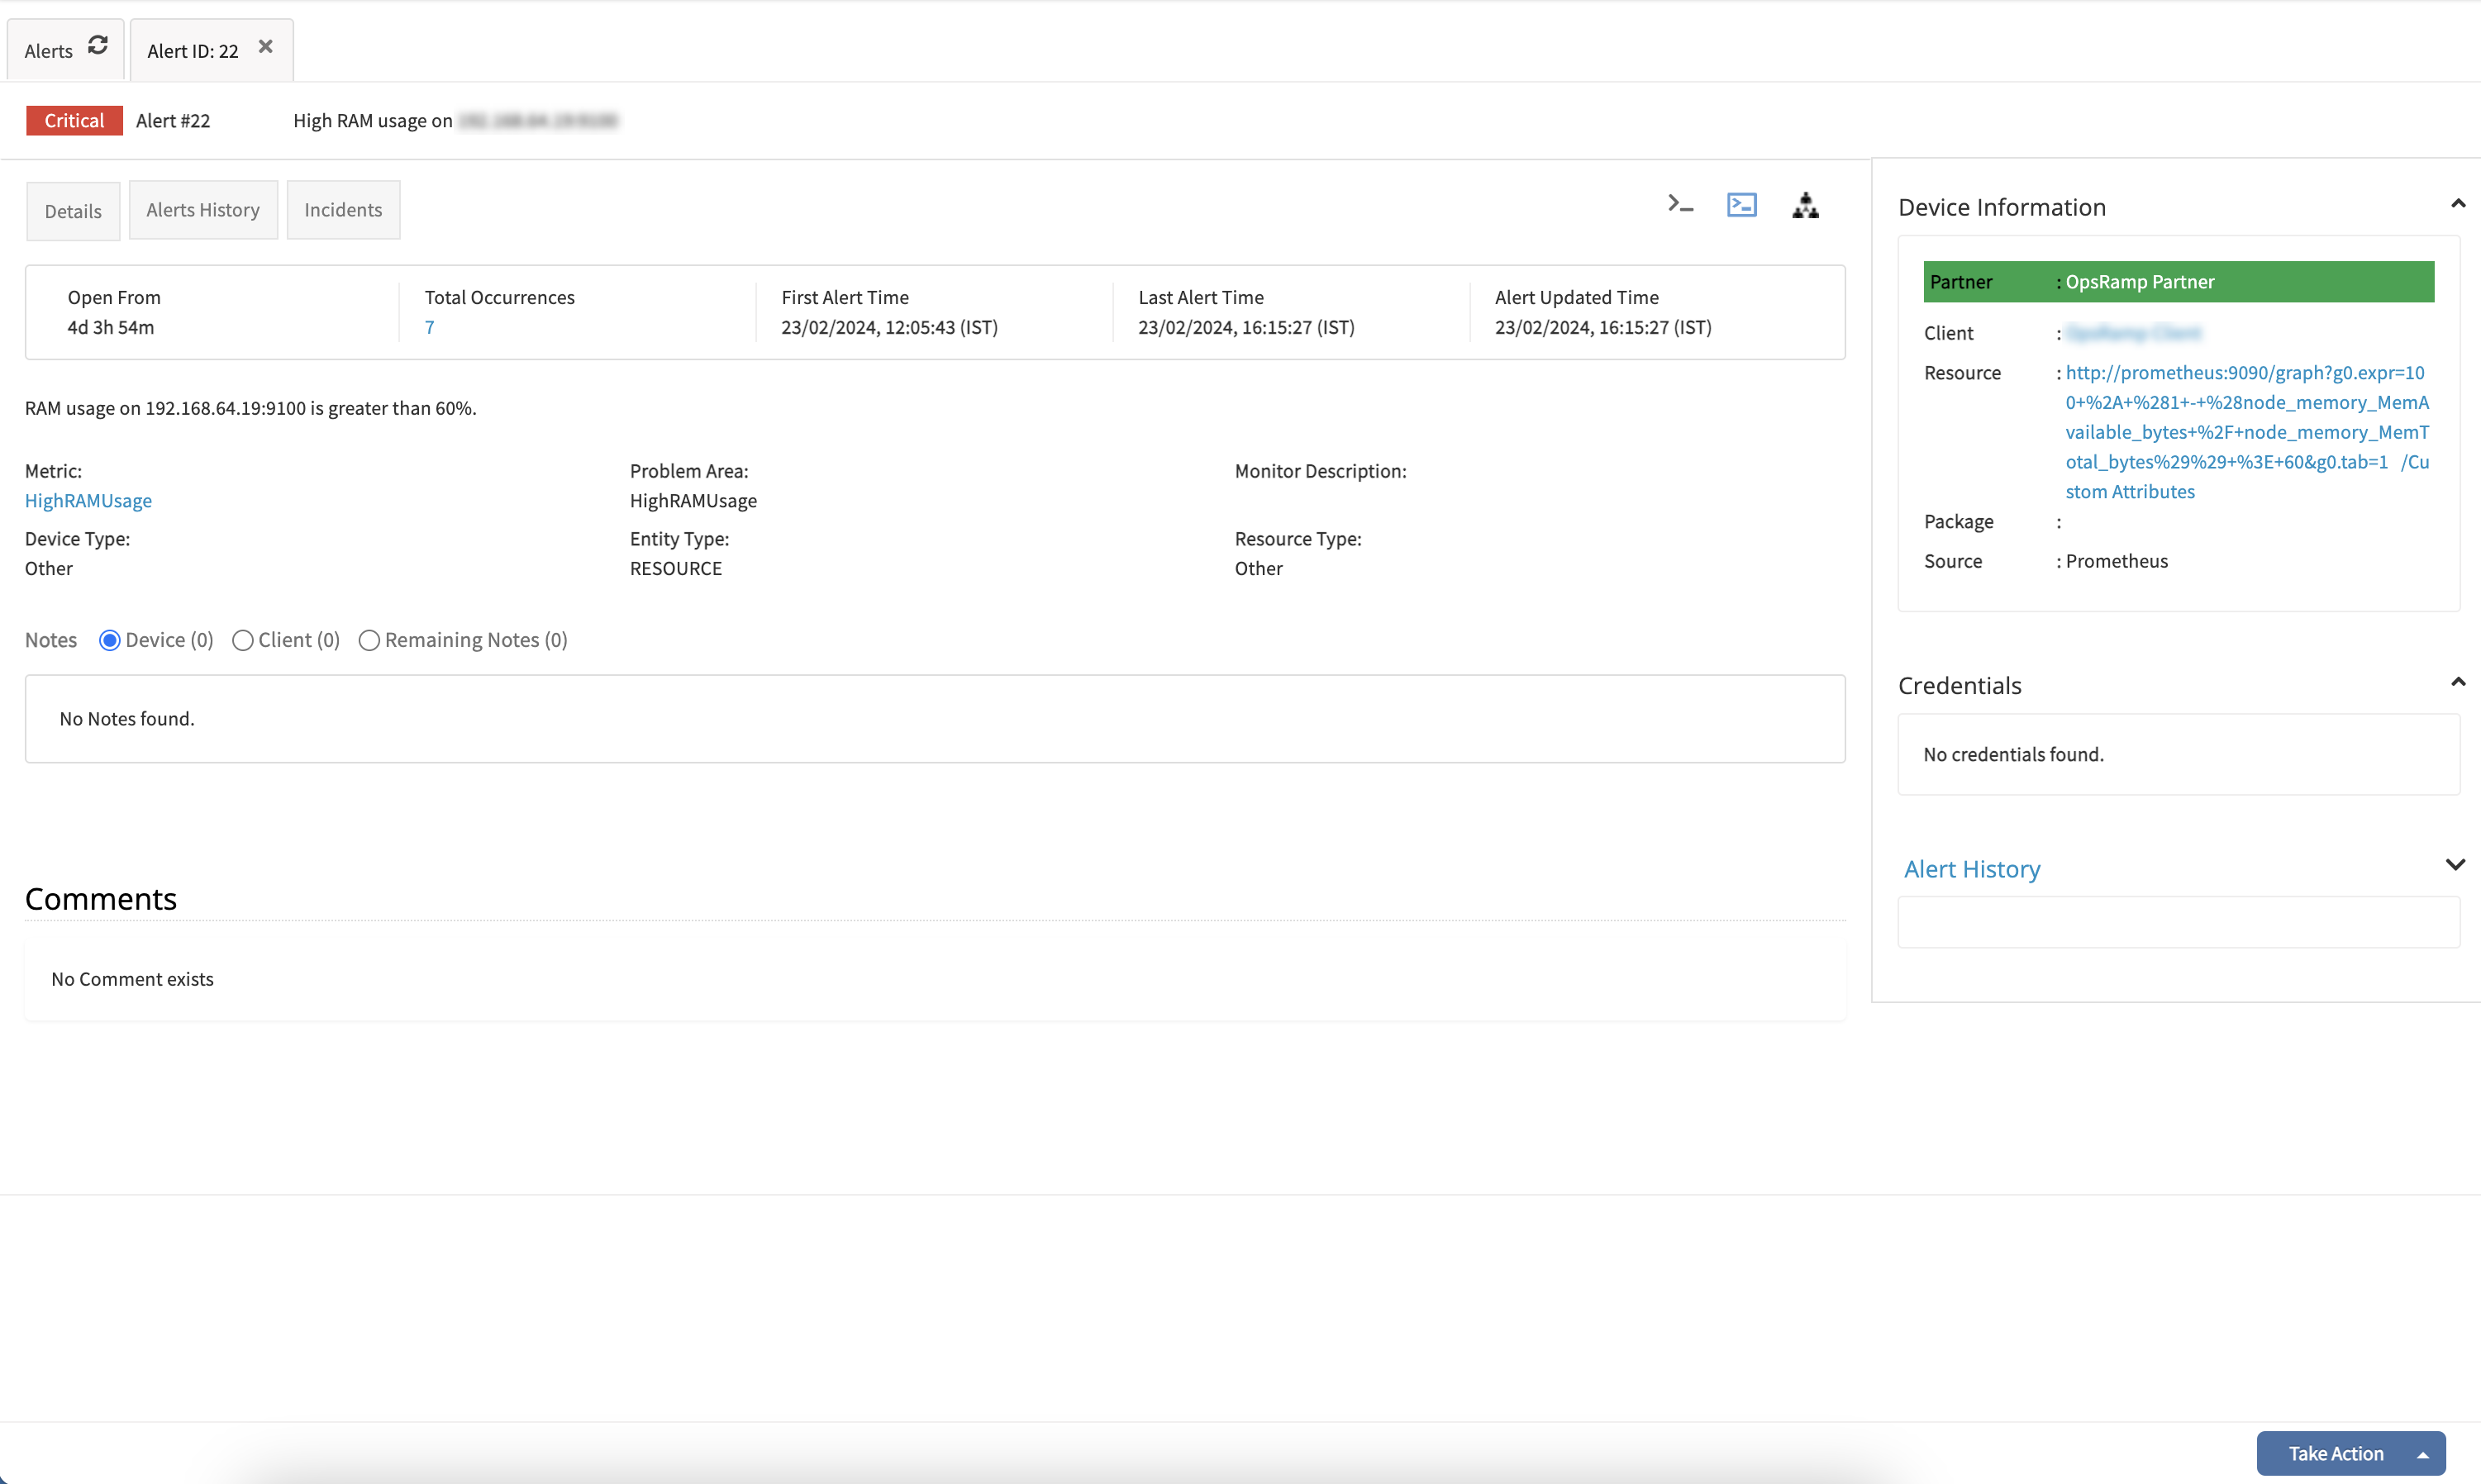
View alerts in OpsRamp.
- From the Workspace drop-down in the OpsRamp Console, navigate to Alerts.
- On the Alerts page, search using Prometheus as the Source name.
The related alerts are displayed. - Click Alert ID to view.
Error Codes - Inbound Webhook Event integration
See Integrations for information on the error codes.