Introduction
Rubrik simplifies backup and recovery for hybrid cloud environments. By combining data orchestration, catalog management, and deduplicated storage into a singular software platform, it removes the complexity of legacy backup systems. Enterprises can use Rubrik’s API-first software tool to automate automation and unlock cloud for long-term data retention or disaster recovery. Rubrik supports the top operating systems, databases, hypervisors, clouds, and SaaS apps and was made to be vendor-neutral.
Rubrik assists organizations in maintaining data integrity, provides data availability that withstands challenging circumstances, constantly tracks data risks and threats, and restores businesses with their data when infrastructure is attacked.
Key Use cases
Discovery Use cases
- It discovers the Rubrik Cluster components.
- Publishes relationships between resources to have a topological view and ease of maintenance.
Monitoring Use cases
- Provides metrics related to job scheduling time and status etc,.
- Generates alerts for each metric and notifies administrators about the issue with the resource.
Supported Target Versions
Rubrik cluster software version: 8.0.2-p2-22662
Prerequisites
- OpsRamp Classic Gateway(Linux) 14.0.0 and above.
- OpsRamp NextGen Gateway 14.0.0 and above.
Note: OpsRamp recommends using the latest Gateway version for full coverage of recent bug fixes, enhancements, etc. - Provided IpAddress/hostname, credentials should work for Rubrik REST API’s.
Hierarchy of Rubrik resources
- Rubrik Cluster
- Rubrik Node
- Rubrik Disk
Supported Metrics
Click here to view the supported metrics
| Native Type | Metric Names | Display Name | Unit | Application Version | Description |
|---|---|---|---|---|---|
| Rubrik Cluster | rubrik_cluster_runwayRemaining | Rubrik Cluster Runway Remaining | Days | 1.0.0 | Number of days remaining before the system fills up. |
| rubrik_cluster_Status | Rubrik Cluster Status | 1.0.0 | Status of the Rubrik cluster. | ||
| rubrik_cluster_StorageUsage | Rubrik Cluster Storage Usage | GB | 1.0.0 | Used storage of the Rubrik cluster. | |
| rubrik_cluster_StorageUtilization | Rubrik Cluster Storage Utilization | % | 1.0.0 | Storage utilization of the Rubrik cluster. | |
| rubrik_cluster_PhysicalDataIngestion | Rubrik Cluster Physical Data Ingestion | Bytes/sec | 1.0.0 | Physical data ingestion of the Rubrik cluster. | |
| rubrik_cluster_ReadIOPS | Rubrik Cluster Read IOPS | IOPS | 1.0.0 | Read IOPS of Rubrik cluster. | |
| rubrik_cluster_WriteIOPS | Rubrik Cluster Write IOPS | IOPS | 1.0.0 | Write IOPS of Rubrik cluster. | |
| rubrik_cluster_ReadIOThroughput | Rubrik Cluster Read IO Throughput | Bytes/sec | 1.0.0 | ReadIO throughput statistics of Rubrik cluster. | |
| rubrik_cluster_WriteIOThroughput | Rubrik Cluster Write IO Throughput | Bytes/sec | 1.0.0 | WriteIO throughput statistics of Rubrik cluster. | |
| rubrik_task_SuccessCount | Rubrik Task Success Count | count | 1.0.0 | Success count of tasks on Rubrik cluster. | |
| rubrik_task_FailureCount | Rubrik Task Failure Count | count | 1.0.0 | Failure count of tasks on Rubrik cluster. | |
| rubrik_job_SuccessCount | Rubrik Job Success Count | count | 1.0.0 | Success count of jobs run in the last 24 hours. | |
| rubrik_job_FailureCount | Rubrik Job Failure Count | count | 1.0.0 | Failure count of jobs run in the last 24 hours. | |
| rubrik_job_ActiveCount | Rubrik Job Active Count | count | 1.0.0 | Active jobs running for the last 24 hours. | |
| rubrik_job_CanceledCount | Rubrik Job Canceled Count | count | 1.0.0 | Canceled jobs in the last 24 hours. | |
| rubrik_cluster_RegisteredHostStatus | Rubrik Cluster Registered Host Status | 1.0.0 | Connection status of hosts registered to Rubrik cluster. | ||
| rubrik_resource_APIStats | Rubrik API Statistics | count | 2.0.0 | Provides the number of API calls and resources made within the frequency. | |
| rubrik_event_Statistics | Rubrik Event Statistics | 1.0.0 | Provides the count of the number of events polled within the frequency | ||
| Rubrik Node | rubrik_node_Status | Rubrik Node Status | 1.0.0 | Status of the Rubrik cluster node. | |
| rubrik_node_ReadIOPS | Rubrik Node Read IOPS | IOPS | 1.0.0 | Rubrik cluster node read IOPS. | |
| rubrik_node_WriteIOPS | Rubrik Node Write IOPS | IOPS | 1.0.0 | Rubrik cluster node write IOPS. | |
| rubrik_node_ReadIOThroughput | Rubrik Node Read IO Throughput | Bytes/sec | 1.0.0 | Rubrik cluster node read IO throughput. | |
| rubrik_node_WriteIOThroughput | Rubrik Node Write IO Throughput | Bytes/sec | 1.0.0 | Rubrik cluster node write IO throughput. | |
| Rubrik Disk | rubrik_disk_Status | Rubrik Disk Status | 1.0.0 | Status of the Rubrik cluster node disk. | |
| rubrik_disk_Usage | Rubrik Disk Usage | GB | 1.0.0 | Rubrik cluster node disk usage. | |
| rubrik_disk_Utilization | Rubrik Disk Utilization | % | 1.0.0 | Rubrik cluster node disk utilization. |
Default Monitoring Configurations
Rubrik has default Global Device Management Policies, Global Templates, Global Monitors and Global metrics in OpsRamp. You can customize these default monitoring configurations as per your business use cases by cloning respective Global Templates and Global Device Management Policies. OpsRamp recommends performing the below activity before installing the application to avoid noise alerts and data.
Default Global Device Management Policies
OpsRamp has a Global Device Management Policy for each Native Type of Rubrik Cluster. You can find those Device Management Policies at Setup > Resources > Device Management Policies, search with suggested names in global scope. Each Device Management Policy follows below naming convention:
{appName nativeType - version}Ex: rubrik Rubrik Cluster - 1 (i.e, appName = rubrik, nativeType =Rubrik Cluster, version = 1)
Default Global Templates
OpsRamp has a Global template for each Native Type of Rubrik Cluster. You can find those templates at Setup > Monitoring > Templates, search with suggested names in global scope. Each template follows below naming convention:
{appName nativeType 'Template' - version}Ex: rubrik StorageGRID Template - 1 (i.e, appName = rubrik , nativeType = Rubrik Cluster, version = 1)
Default Global Monitors
OpsRamp has a Global Monitors for each Native Type which has monitoring support. You can find those monitors at Setup > Monitoring > Monitors, search with suggested names in global scope. Each Monitors follows below naming convention:
{monitorKey appName nativeType - version}Ex: Rubrik Cluster Monitor rubrik Rubrik Cluster 1 (i.e, monitorKey = Rubrik Cluster Monitor, appName = rubrik , nativeType = Rubrik Cluster, version= 1)
Configure and Install the Rubrik Integration
From All Clients, select a client.
Navigate to Setup > Account.
Select the Integrations and Apps tab.
The Installed Integrations page, where all the installed applications are displayed. If there are no installed applications, it will navigate to the Available Integrations and Apps page.
Click + ADD on the Installed Integrations page. The Available Integrations and Apps page displays all the available applications along with the newly created application with the version.
Note: Search for the application using the search option available. Alternatively, use the All Categories option to search.Click ADD on the Rubrik integration card. The Add Configuration page appears.
Enter the below mentioned BASIC INFORMATION:

| Field Name | Description | Field Type | |
|---|---|---|---|
| Name | Enter the name for the configuration. | String | |
| Rubrik Cluster IP Address/Host Name | Enter the Host name or the IP address. | Integer | |
| Rubrik REST API Port | Enter the API Port information | String | |
| Is Secure | Select this checkbox if you want the communication between your system and the specified endpoint to be secured using protocols such as HTTPS (HTTP over SSL/TLS). Default Selection: When selected, it signifies that the connection is encrypted, providing an added layer of security to the data being transmitted. | Checkbox | |
| Credentials | Select the credential associated with your Weka account. If you want to use the existing credentials, select them from the Select Credentials dropdown. Else, click + Add to create credentials. The ADD CREDENTIAL window is displayed. Enter the following information.
| Dropdown | |
| App Failure Notifications | When selected, you will be notified in case of an application failure such as Connectivity Exception, Authentication Exception. | Checkbox | |
| Alert Configuration | When selected, the Rubrik Events will generate based on Alert Severity and Alert Severity Mapping configuration. | Checkbox | |
| Alert Severity | Appears when Alert Configuration is selected. Provides alerts severity and gets integrated out of all possible alerts. Critical, Warning, Informational. | String | |
| Alert Severity Mapping | Appears when Alert Configuration is selected. Provides alert severity map configuration. Possible values of Alert Severity Mapping Filter configuration property are {“Critical”:“Critical”,“Warning”:“Warning”,“Informational”:“Warning”} | String | |
| Rubrik Event Type (Optional) | All events are captured by default. If filtering is required, specify the event types, separated by commas. Rubrik Event Type possible values: Archive, Audit, AuthDomain, AwsEvent, Backup, Classification, CloudNativeSource, CloudNativeVm, Configuration, Connection, Conversion, Diagnostic, Discovery, Failover, Fileset, Hardware, Hdfs, HostEvent, HypervScvmm, HypervServer, Index, Instantiate, LegalHold, Maintenance, NutanixCluster, Recovery, Replication, ResourceOperations, Storage, StorageArray, StormResource, Support, System, TestFailover, ThreatHunt, Tpr, Upgrade, VCenter, Vcd, VolumeGroup, UnknownEventType, etc. | String |
- Select the below mentioned Custom Attribute:
| Functionality | Description |
|---|---|
| Custom Attribute | Select the custom attribute from the drop down list box. |
| Value | Select the value from the drop down list box. |
Note: The custom attribute that you add here will be assigned to all the resources that are created by the integration. You can add a maximum of five custom attributes (key and value pair).
- In the RESOURCE TYPE section, select:
- ALL: All the existing and future resources will be discovered.
- SELECT: You can select one or multiple resources to be discovered.
- In the DISCOVERY SCHEDULE section, select Recurrence Pattern to add one of the following patterns:
- Minutes
- Hourly
- Daily
- Weekly
- Monthly
- Click ADD.

Now the configuration is saved and displayed on the configurations page after you save it.
Note: From the same page, you may Edit and Remove the created configuration.
- Click Next.
- Below are the optional steps you can perform on the Installation page.
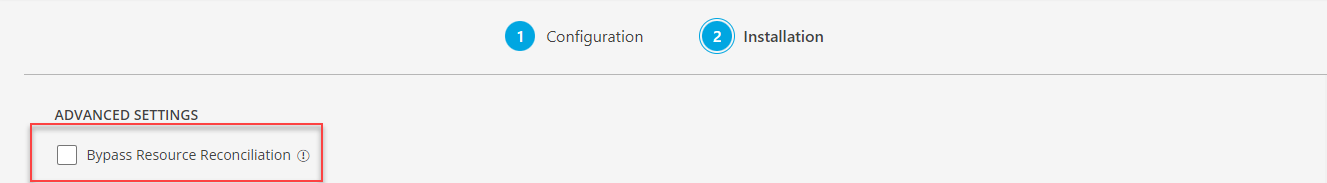
Under the ADVANCED SETTINGS, Select the Bypass Resource Reconciliation option, if you wish to bypass resource reconciliation when encountering the same resources discovered by multiple applications.
Note: If two different applications provide identical discovery attributes, two separate resources will be generated with those respective attributes from the individual discoveries.
- Click +ADD to create a new collector by providing a name or use the pre-populated name.
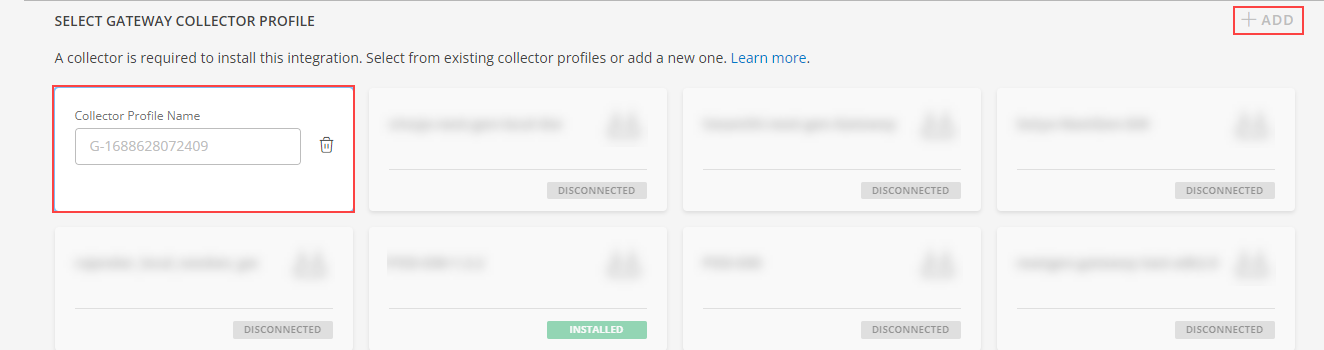
- Select an existing registered profile.
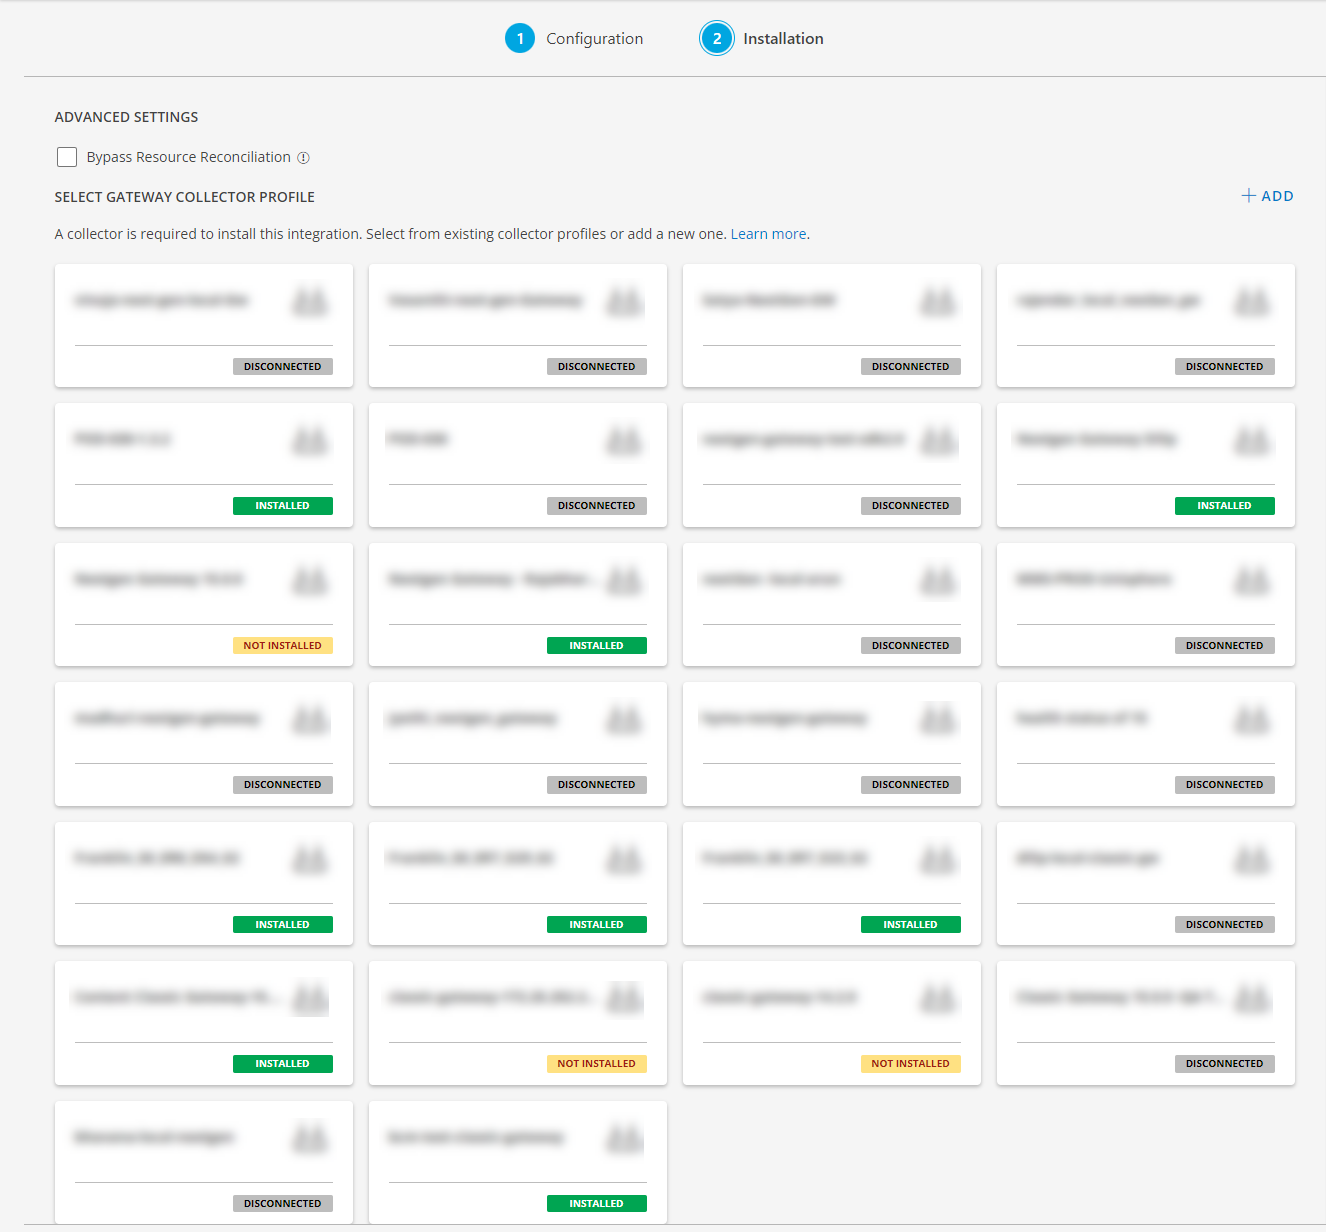
- Click FINISH.
The integration is now installed and displayed on the Installed Integration page. Use the search field to find the installed application.
Modify the Configuration
See Modify an Installed Integration or Application article.
Note: Select the Rubrik application.
View the Rubrik details
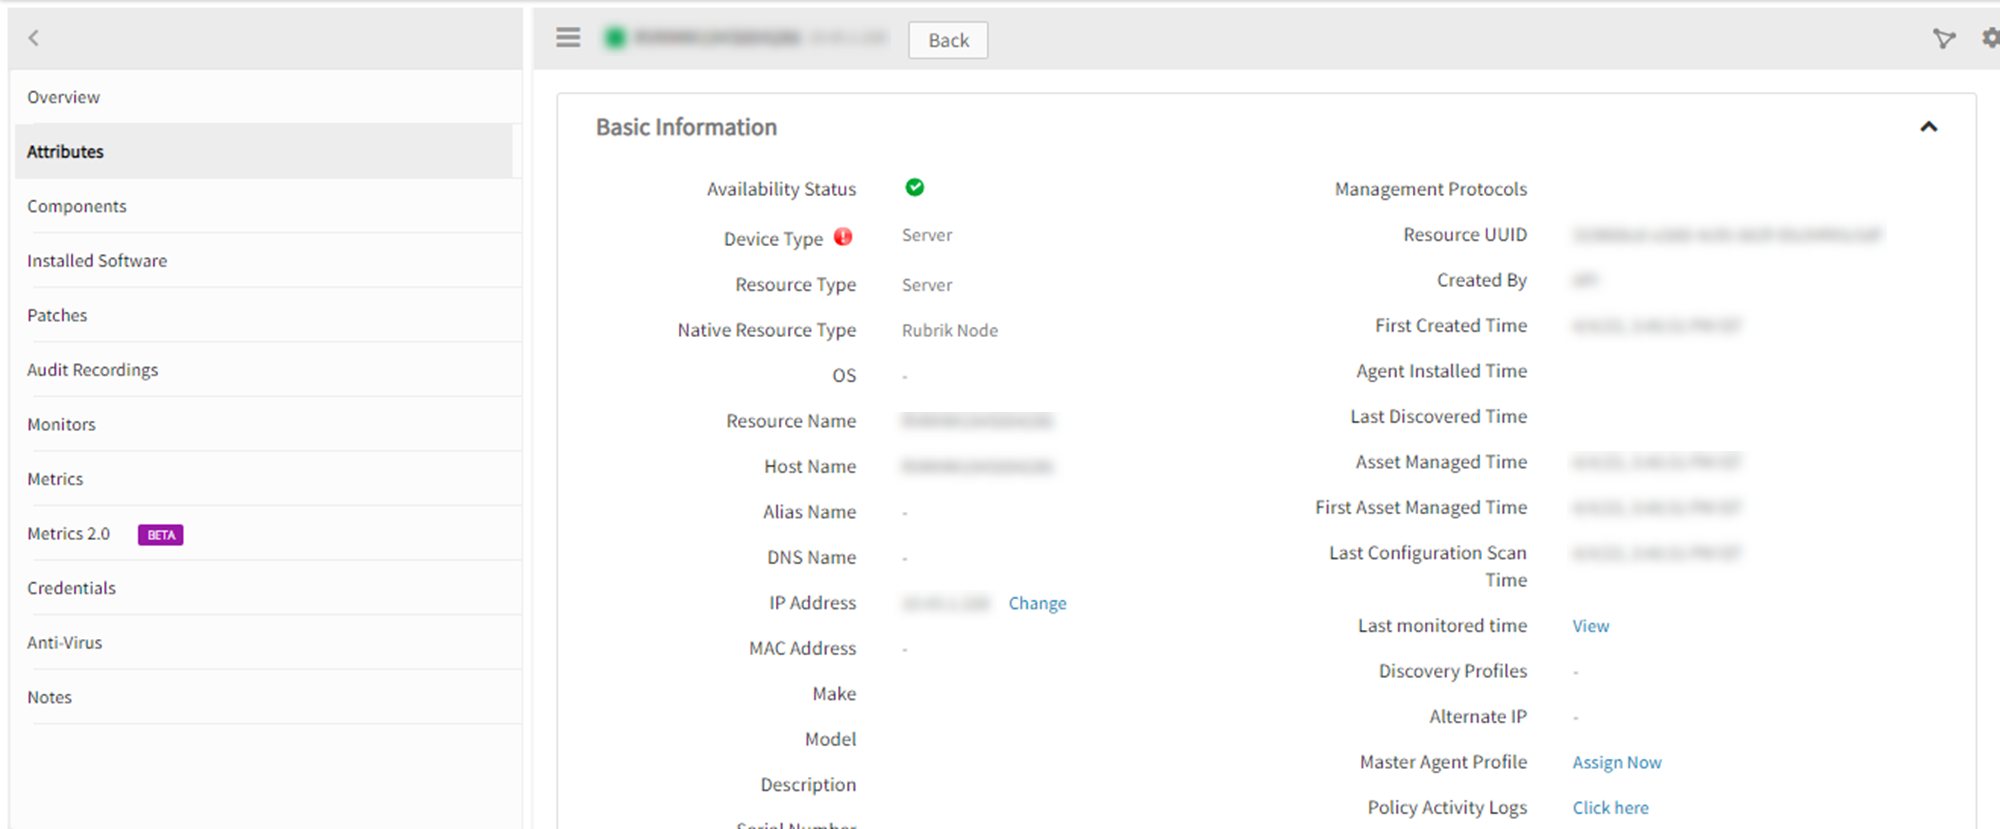
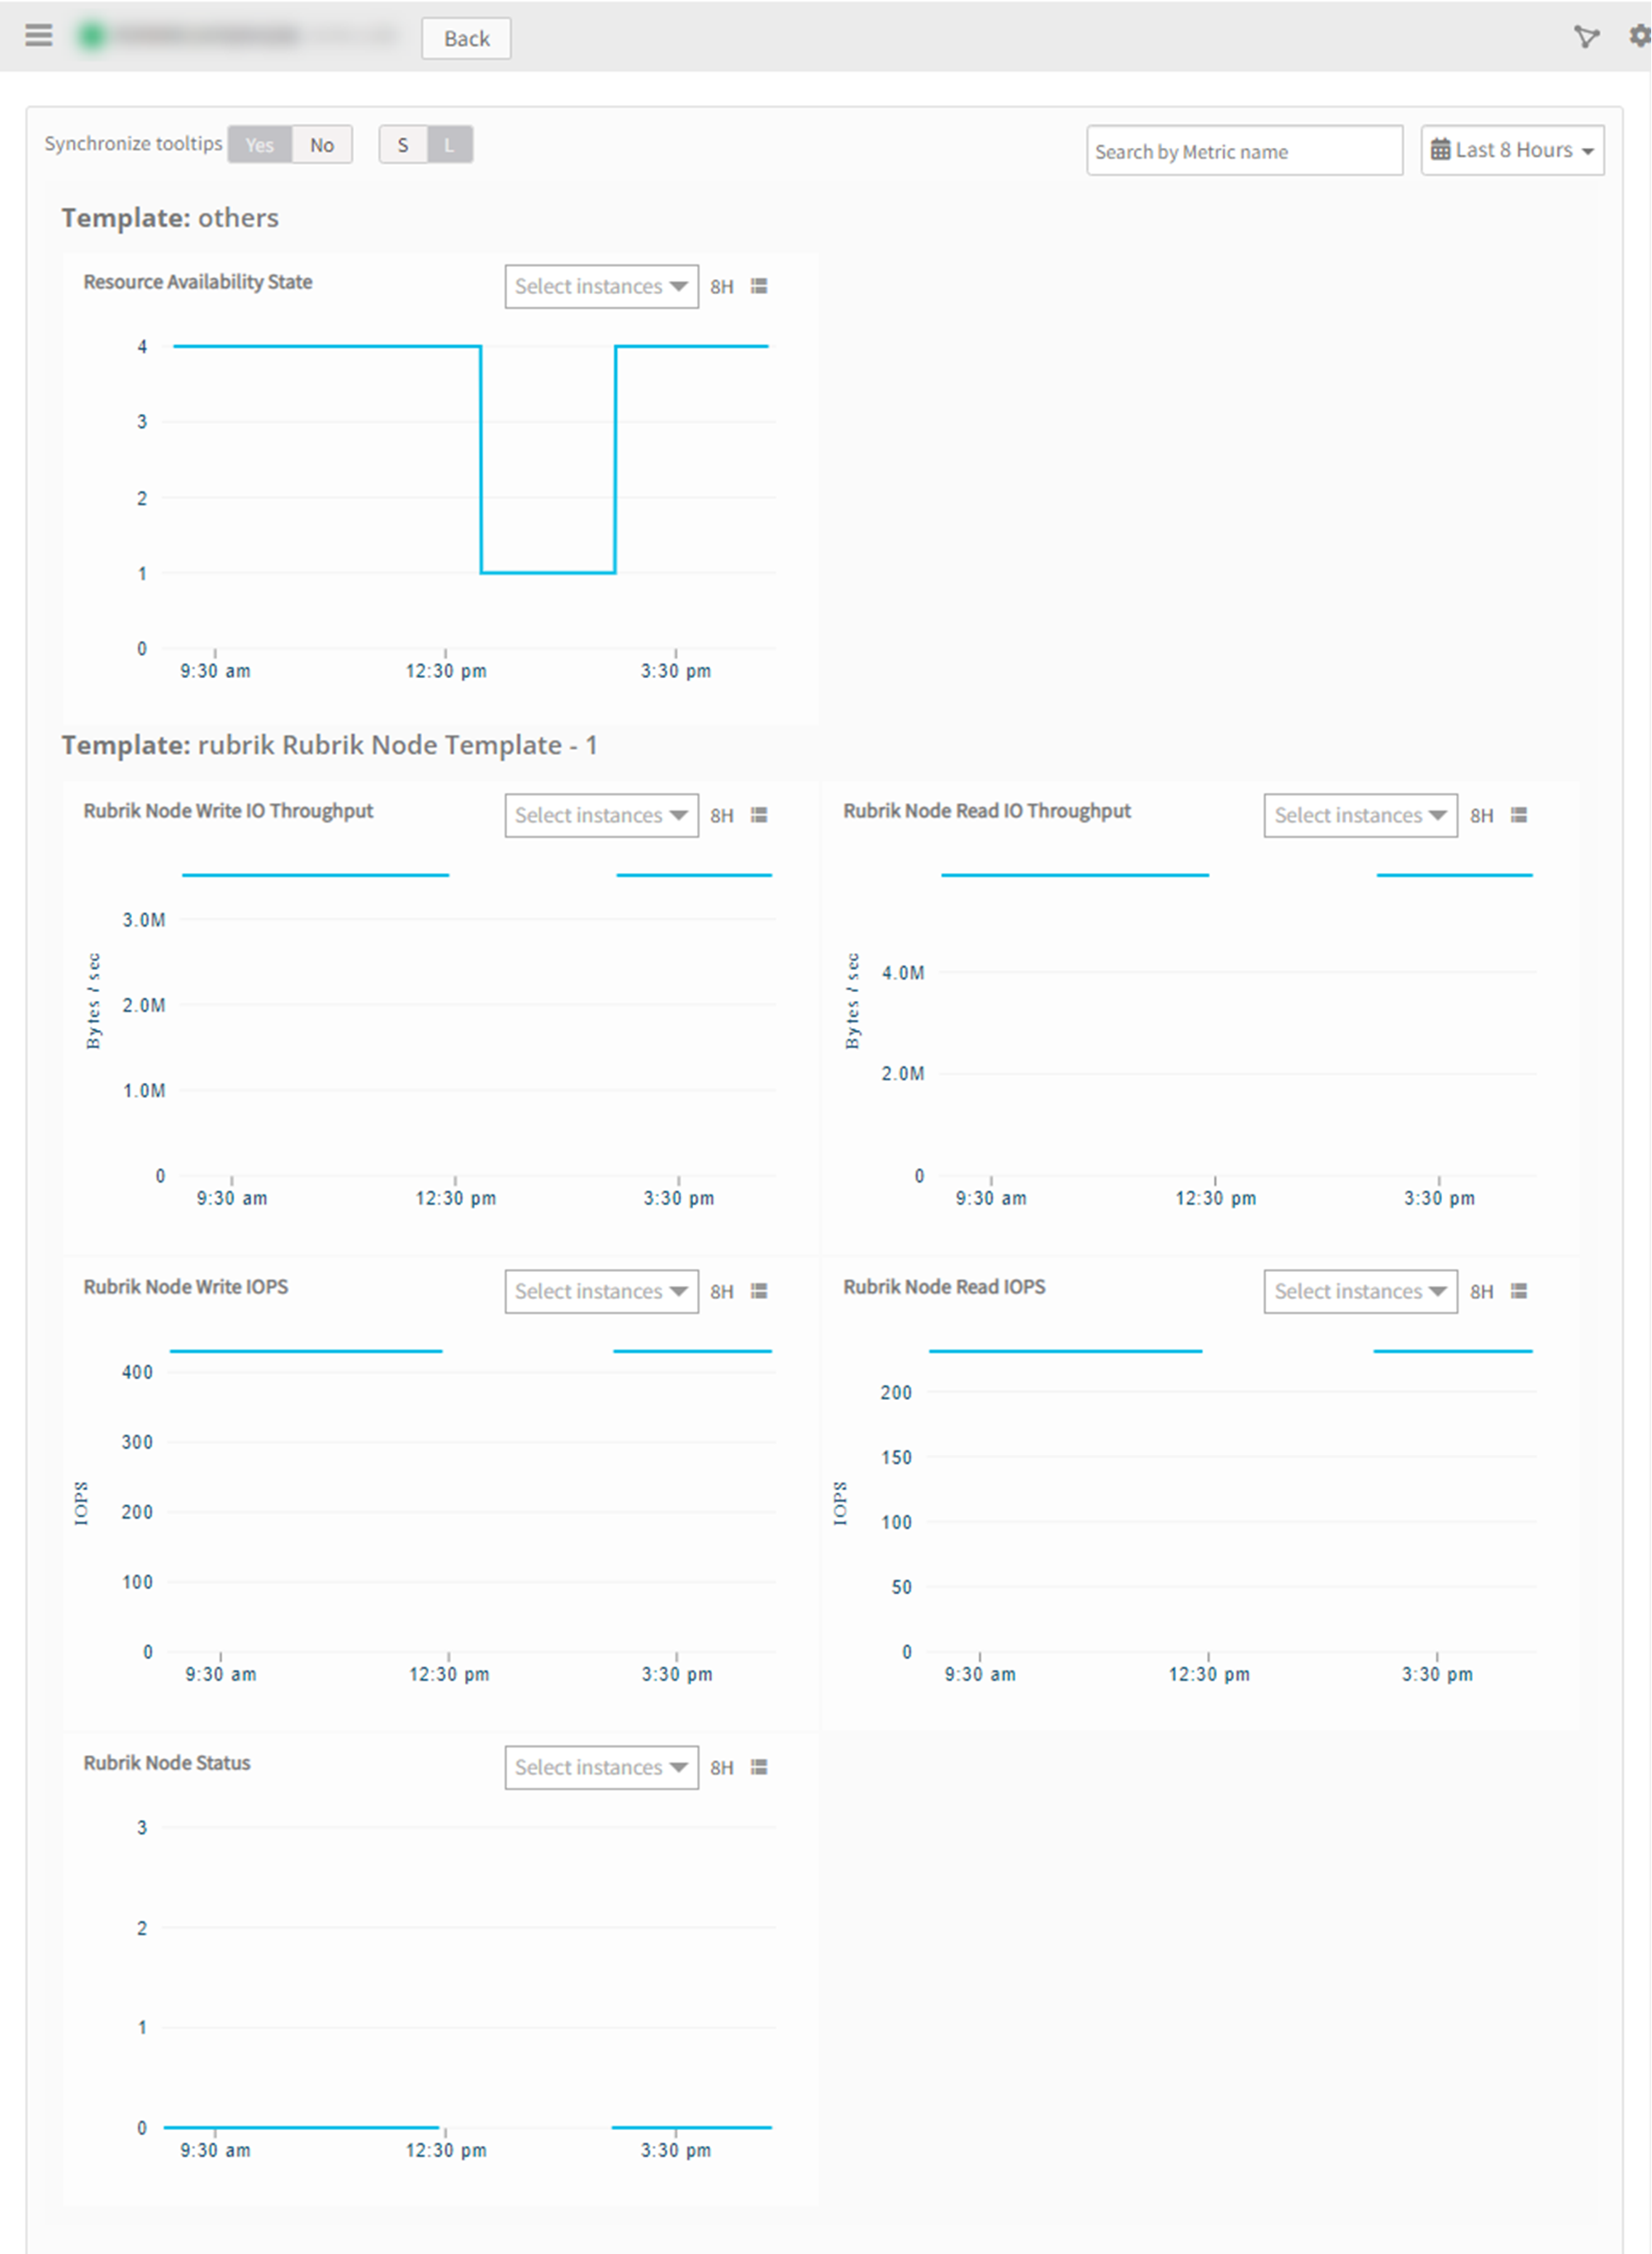
The discovered resource(s) are displayed in Infrastructure > Resources > Server, with Native Resource Type as Rubrik Node. You can navigate to the Attributes tab to view the discovery details, and the Metrics tab to view the metric details for Rubrik Node.
Resource Type Filter Keys
Rubrik application resources are filtered and discovered based on below keys:
Click here to view the Supported Input Keys
| Resource Type | Supported Input Keys |
|---|---|
| All Types | resourceName |
| hostName | |
| aliasName | |
| dnsName | |
| ipAddress | |
| macAddress | |
| os | |
| make | |
| model | |
| serialNumber | |
| Rubrik Cluster | Version |
| API Version | |
| Registered Mode | |
| Timezone | |
| Rubrik Disk | Disk Type |
| Node Id | |
| path | |
| Rubrik Node | BrikId |
Risks and Limitations
Application Failure Notification
When the user enables App Failure Notifications in the configuration, the application can handle critical and recovery failure notifications for the following cases:
- Connectivity Exception
- Authentication Exception
The application will not send duplicate or repeated failure alert notifications until the existing critical alert has been recovered. This could lead to missing important repeated failure notifications during ongoing issues.
Alerts are generated based on metrics when predefined thresholds are breached. If thresholds are set incorrectly, users may miss important alerts or be overwhelmed by unnecessary ones.
The application cannot automatically pause or resume monitoring actions based on the generated alerts, limiting control over how the system reacts to specific failures.
The application does not support displaying activity logs, reducing visibility into actions taken or issues logged.
The Template Applied Time will only be displayed if the collector profile (Classic and NextGen Gateway) is version 18.1.0 or higher.
The application cannot associate a failure event with a corresponding healing event. Consequently, no automatic healing mechanism is available, requiring users to manually resolve alerts in every case.
The application supports both Classic Gateway and NextGen Gateway environments.
Troubleshooting
Before troubleshooting Rubrik integration issues, ensure that all prerequisites are followed as per the documented setup guidelines. Cross-check the following:
- Confirm that all connectivity and authentication configurations are correct.
- Ensure the required permissions are set on both the OpsRamp platform and the Rubrik environment.
- Verify that the gateway is properly configured to communicate with the Rubrik resources.
If the Rubrik integration fails to discover or monitor resources, follow these troubleshooting steps:
Inspect if any alerts have been generated on the Rubrik resource, the gateway, or in the vprobe error logs.
If the alert/error is related to connectivity or authentication, check the reachability of the end device from the gateway:
- Ping the device using the IP address provided in the configuration:
ping <IP Address> - Check connectivity to the specific port using telnet:
telnet <IP Address> <port>
- Ping the device using the IP address provided in the configuration:
In some cases, the primary node may switch to another node, requiring an update to the app configuration. Note that when the resource changes to a new node, a new resource is created, and the old metric data may be lost as a result.
Retrieving API or SSH Command Responses from the Gateway Using GCLI Terminal
Follow the steps in the SDK App Debug GCLI Command Requests (Target API / SSH Command) and review if there are any errors.
- Use the following sample request to prepare the request payload:
{ "apiVersion": "debug/v1", "module": "Debug", "app": "rubrik", "action": "Reachability", "payload": { "RubrikIPAddress": "<IP address or hostname>", "protocol": "https", "Port": 443, "requestPath": "<requestPath mention in the below table>", "requestMethod": "GET", "username": "<username>", "password": "<password>" } } - Encode the request payload to Base64 format.
- Login to gateway console and connect to GCLI terminal using the following command
- Execute the command by replacing the
with the Base64-encoded request payload generated in Step 2: - Added Metric Labels support.
- Missing component alerts.
- Change metric instance name as resource name for single instance metrics.
- API statistics metric.
- Full discovery Support.
- We have included "ObjectName" and "ObjectType" in the alert description For correlating Event Polling alerts based on alert description or alert subject.
gcli sdkappdebug base64 encoded string Refer to the following table for preparing the request payload for REST API :
| Native Type | Discovery | Monitoring |
|---|---|---|
| Rubrik Cluster | v1/cluster/me | internal/stats/runway_remaining internal/stats/system_storage internal/stats/physical_ingest/time_series internal/cluster/me/system_status v1/job_monitoring/summary_by_job_type?job_monitoring_state=Success v1/job_monitoring/summary_by_job_type?job_monitoring_state=Failure v1/job_monitoring/summary_by_job_type?job_monitoring_state=Canceled v1/job_monitoring/summary_by_job_type?job_monitoring_state=Active v1/host internal/cluster/me/io_stats?range=-5min internal/report?report_type=Canned&report_template=ProtectionTasksDetails |
| Rubrik Node | internal/cluster/me/node internal/node/{node_id}/io_stats?range=-5min | |
| Rubrik Disk | internal/cluster/me/disk | |
| Event Polling | - | v1/event/latest?order_by_time=desc&before_date={from_date}&after_date={to_date}&event_series_status=Failure |
For example, we want to verify the Rubrik REST API response, use the below payload:
{
  "apiVersion": "debug/v1",
  "module": "Debug",
  "app": "rubrik",
  "action": "Reachability",
  "payload": {
    "RubrikIPAddress": "11.22.33.44",
    "protocol": "https",
    "Port": 443,
    "requestPath": "v1/cluster/me",

    "requestMethod" :"GET",

    "username": "<username>",
    "password": "<password>"

}
}
Version History
| Application Version | Bug fixes / Enhancements |
|---|---|
| 2.0.6 | Added support for all critical and warning severity alerts and then added support for event type filtering. |
| 2.0.5 | Provided fix for Get Latest Metrics, Activity Logger and DebugHandler Changes. |
| 2.0.4 | Added support to perform discovery and monitoring using the other available nodes if the primary node is unable to make API calls. |
| 2.0.2 | Added support for NativeType Display order changes and resource grouping by type in UI |
| 2.0.3 | Bug Fix for metrics intermittent issue |
| 2.0.1 |
Click here to view the earlier version updates
| Application Version | Bug fixes / Enhancements |
|---|---|
| 2.0.0 | |
| 1.0.0 | Initial SDK2.0 app Discovery and Monitoring Implementations. |