Introduction
The Alert Listing application will provide a comprehensive and detailed list of alerts. This list provides specific information about each alert, including its source, severity level, timestamp, and any associated actions or recommendations.
Configuration Parameters
- Add Query: Use the query to select the entities that you wish to include in the report.
- Default query: The default query { status IN (“OPEN”, “ACKNOWLEDGED”, “TICKETED”, “SUPPRESSED”, “CORRELATED”) AND UpdatedTime >= -7d }will be populated by default when opens alert listing app. User can able to modify/delete the default query and run his specific query
- Using an OpsQL query, you can customize the report result. If users did not select “Time related attributes” in the query string, in that case the user selection query would be appended by default.
For example: If a user only selects the alertType attributes, the query will automatically append withAND updatedTime > '-7d'
The query will look like below:
(alertType = “MONITORING”) AND updatedTime > ‘-7d’
- Client Selection: You can select a single client/ All clients from the dropdown list. Only selected client data will get into the report.
- Attributes Selection: Specify the attributes of the selected entities that you wish to include as columns in the report.
- Default attributes: The default attributes (Alert Id, Object Name, Object Type, Ip Address, Subject, Metric, Current State, Created Time, Is Inference Alert, Inference Id) will be populated by default. User can modify/delete default attributes and select his required attributes to view in the report.
- Only selected attributes related data will be included in the report. If no attributes are selected, the default attributes data will be included in the report.
- You can customize the default attributes selection order by using the drag and drop functionality. You are allowed to select a maximum of 20 attributes.
Note
The UI page will only display the first 10 selected attributes from the configuration parameter section for the run results. This is due to better UI representation. If you want to see all of the selected attributes (more than 10), then download and open the run report in excel format.
- Select Tags: Specify the custom attributes of selected entities to include columns in the report. You are allowed to select a maximum of 5 tags.
- Supported Format: Reports are generated only in XLSX format.
Reports Output
Once the report is generated, it will consist of the following sections:
- Summary: This section provides the configuration details.
- Alerts and Inferences: This section presents a list of alerts and inferences that were triggered in your environment.
- Inferences and Uncorrelated Alerts: Here, you will find a list of inferences and uncorrelated alerts that were triggered in your environment.
- Glossary: This section contains detailed information about each section present in the report tab, helping you to understand the generated data better.
Sample of reports in XLSX format: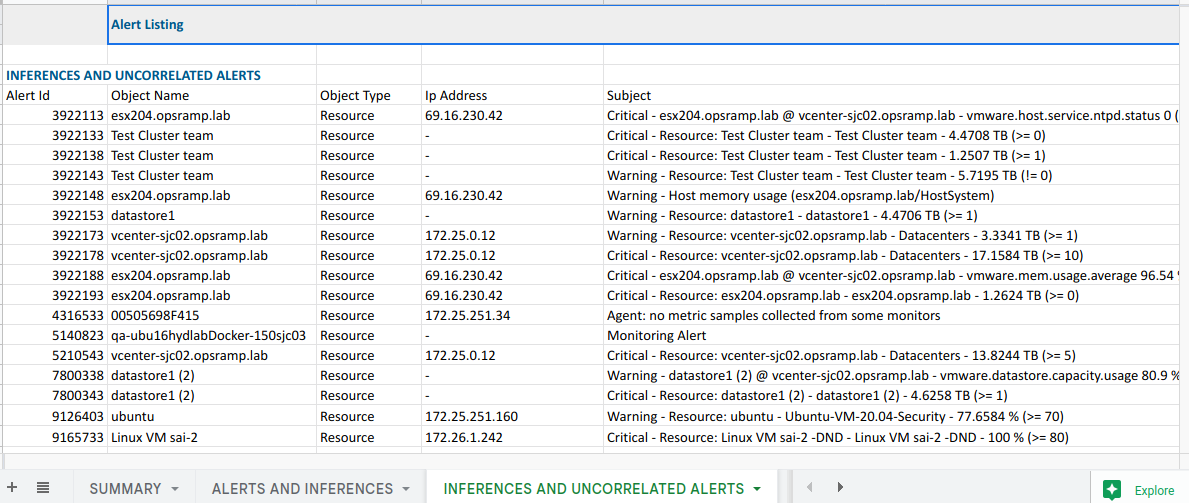
Alert Report Vs Alert Listing Atrributes
Click here to view the supported attributes
| Alert Report | Alert Listing | |
|---|---|---|
| UI Atrributes Selection | Display Format In Report | |
| Aler ID | id | Id |
| Latest Update (IST) | updatedTime | Updated Time |
| Subject | subject | Subject |
| Current Status | currentState | Current State |
| Partner Name | resource.partnerName | Partner Name |
| Client Name | resource.clientName, clientName | Client Name |
| Source | source | Source |
| Host Name | resource.hostName | Host Name |
| Alias Name | resource.aliasName | Alias Name |
| Device State | resource.state | State |
| Host IP | resource.ipAddress, ipAddress | Ip Address |
| Alert Type | alertType | Alert Type |
| Metric | metric | Metric |
| Component | component | Component |
| Ticket ID | incidentId | Incident Id |
| Occurrence Count | repeatCount | Repeat Count |
| Elapsed Time (HH:MM:SS) | elapsedTime | Elapsed Time |
| Healed Time (HH:MM:SS) | alertCriticalWarningDuration | Healed Time |
| Created Time (IST) | createdTime | Created Time |
| Device ID | resource.id | Resource Id |
| Event Type | isInferenceAlert | Is Inference Alert |
| Action Taken | status | Status |
| Device Maintenance Window | maintenanceWindow.name | Maintenance Window Name |
| Device Path | resource.resourceTypePath | Resource Type Path |
| Device Type | resource.type | Type |
| Device Group | resource.deviceGroups.name, deviceGroups.name | Device Groups Name |
| Site | resource.location | Location |
| Priority | priority | Priority |
| Acknowledged By | statusHistory.acknowledgedBy | Acknowledged By |
| Acknowledged Time (IST) | statusHistory.acknowledgedTime | Acknowledged Time |
| Created By | statusHistory.openBy | Created By |
| Suppressed By | statusHistory.suppressedBy | Suppressed By |
| Suppressed Time (IST) | statusHistory.suppressedTime | Suppressed Time |
| Ticketed By | statusHistory.ticketedBy | Ticketed By |
| Ticketed Time (IST) | statusHistory.ticketedTime | Ticketed Time |
| Closed By | statusHistory.closedBy | Closed By |
| Closed Time (IST) | statusHistory.closedTime | Closed Time |
| Integration | N/A | N/A |
| RBA Invoked | N/A | N/A |
| N/A | alertDefinitionUUID | Alert Definition UUID |
| N/A | clientId | Client Id |
| N/A | correlatedAlertsCount | Correlated Alerts Count |
| N/A | description | Description |
| N/A | resource.deviceGroups.uniqueId | Device Groups UniqueId |
| N/A | deviceGroups.uniqueId | Device Groups UniqueId |
| N/A | dnsName | Dns Name |
| N/A | inferenceId | Inference Id |
| N/A | isAvailabilityAlert | Is Availability Alert |
| N/A | maintenanceWindow.uniqueId | Maintenance Window UniqueId |
| N/A | nocId | Noc Id |
| N/A | nocName | Noc Name |
| N/A | objectId | Object Id |
| N/A | objectName | Object Name |
| N/A | objectType | Object Type |
| N/A | observedMode | Observed Mode |
| N/A | originalState | Original State |
| N/A | partnerId | Partner Id |
| N/A | problemArea | Problem Area |
| N/A | promQL | Prom Q L |
| N/A | resourceMaintenanceWindowId | Resource Maintenance Window Id |
| N/A | resourceTags.name | ResourceTags Name |
| N/A | resourceTags.value | ResourceTags Value |
| N/A | serviceGroups.name | ServiceGroups Name |
| N/A | serviceGroups.uniqueId | ServiceGroups UniqueId |
| N/A | serviceProviderId | Service Provider Id |
| N/A | statusHistory.unAcknowledgedBy | Un Acknowledged By |
| N/A | statusHistory.unSuppressedBy | Un Suppressed By |
| N/A | tags | Tags |
| N/A | team | Team |
| N/A | ticketId | Ticket Id |
| N/A | viewName | View Name |
| N/A | serviceGroups.id | Service Groups Id |
Next Steps
Refer to the Installation documentation on how to install and configure the apps.