Overview
Simple Network Management Protocol (SNMP) is an application-layer protocol for monitoring and managing network devices and other SNMP-supported devices.

SNMP Versions
- SNMP v1
- SNMP v2c
- SNMP v3
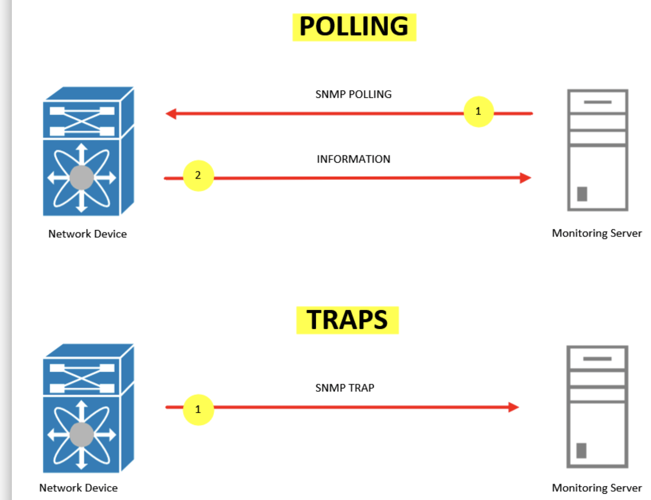
Types of SNMP Monitoring
- Poll-based Monitoring (Template)
- Trap-based Monitoring
- Discovery Support
Prerequisites for Enabling Monitoring
- Poll-based Monitoring (Template): SNMP Full Walk and Device-specific MIBs
- Trap-based Monitoring: Device-specific MIBs
- Discovery Support: SNMP Full Walk and Device-specific MIBs
Getting Started:
- To get SNMP Walk, see How to execute SNMPWALK.
- To create a SNMP monitor, see Simple Network Management Protocol (SNMP).
- To see template details, refer to the following.
- To get MIB files, they are available in the device packaging or on the device’s portal, depending on the model.
Troubleshooting & FAQ’s
This section helps troubleshoot common issues encountered while using SNMP monitors. Each use case below provides step-by-step solutions for identifying and resolving common SNMP monitoring issues.
Use Case 1: Avoiding Incomplete SNMP Full Walk
When running the SNMP full walk command, .1 is mandatory after the IP address to retrieve the complete walk. This parameter ensures you capture all data in the SNMP walk command.
Depending on the size of SNMP data on the device, the walk may take time to execute. Wait until the process completes and all data is collected.
Use Case 2: Verifying SNMP Full Walk Completion
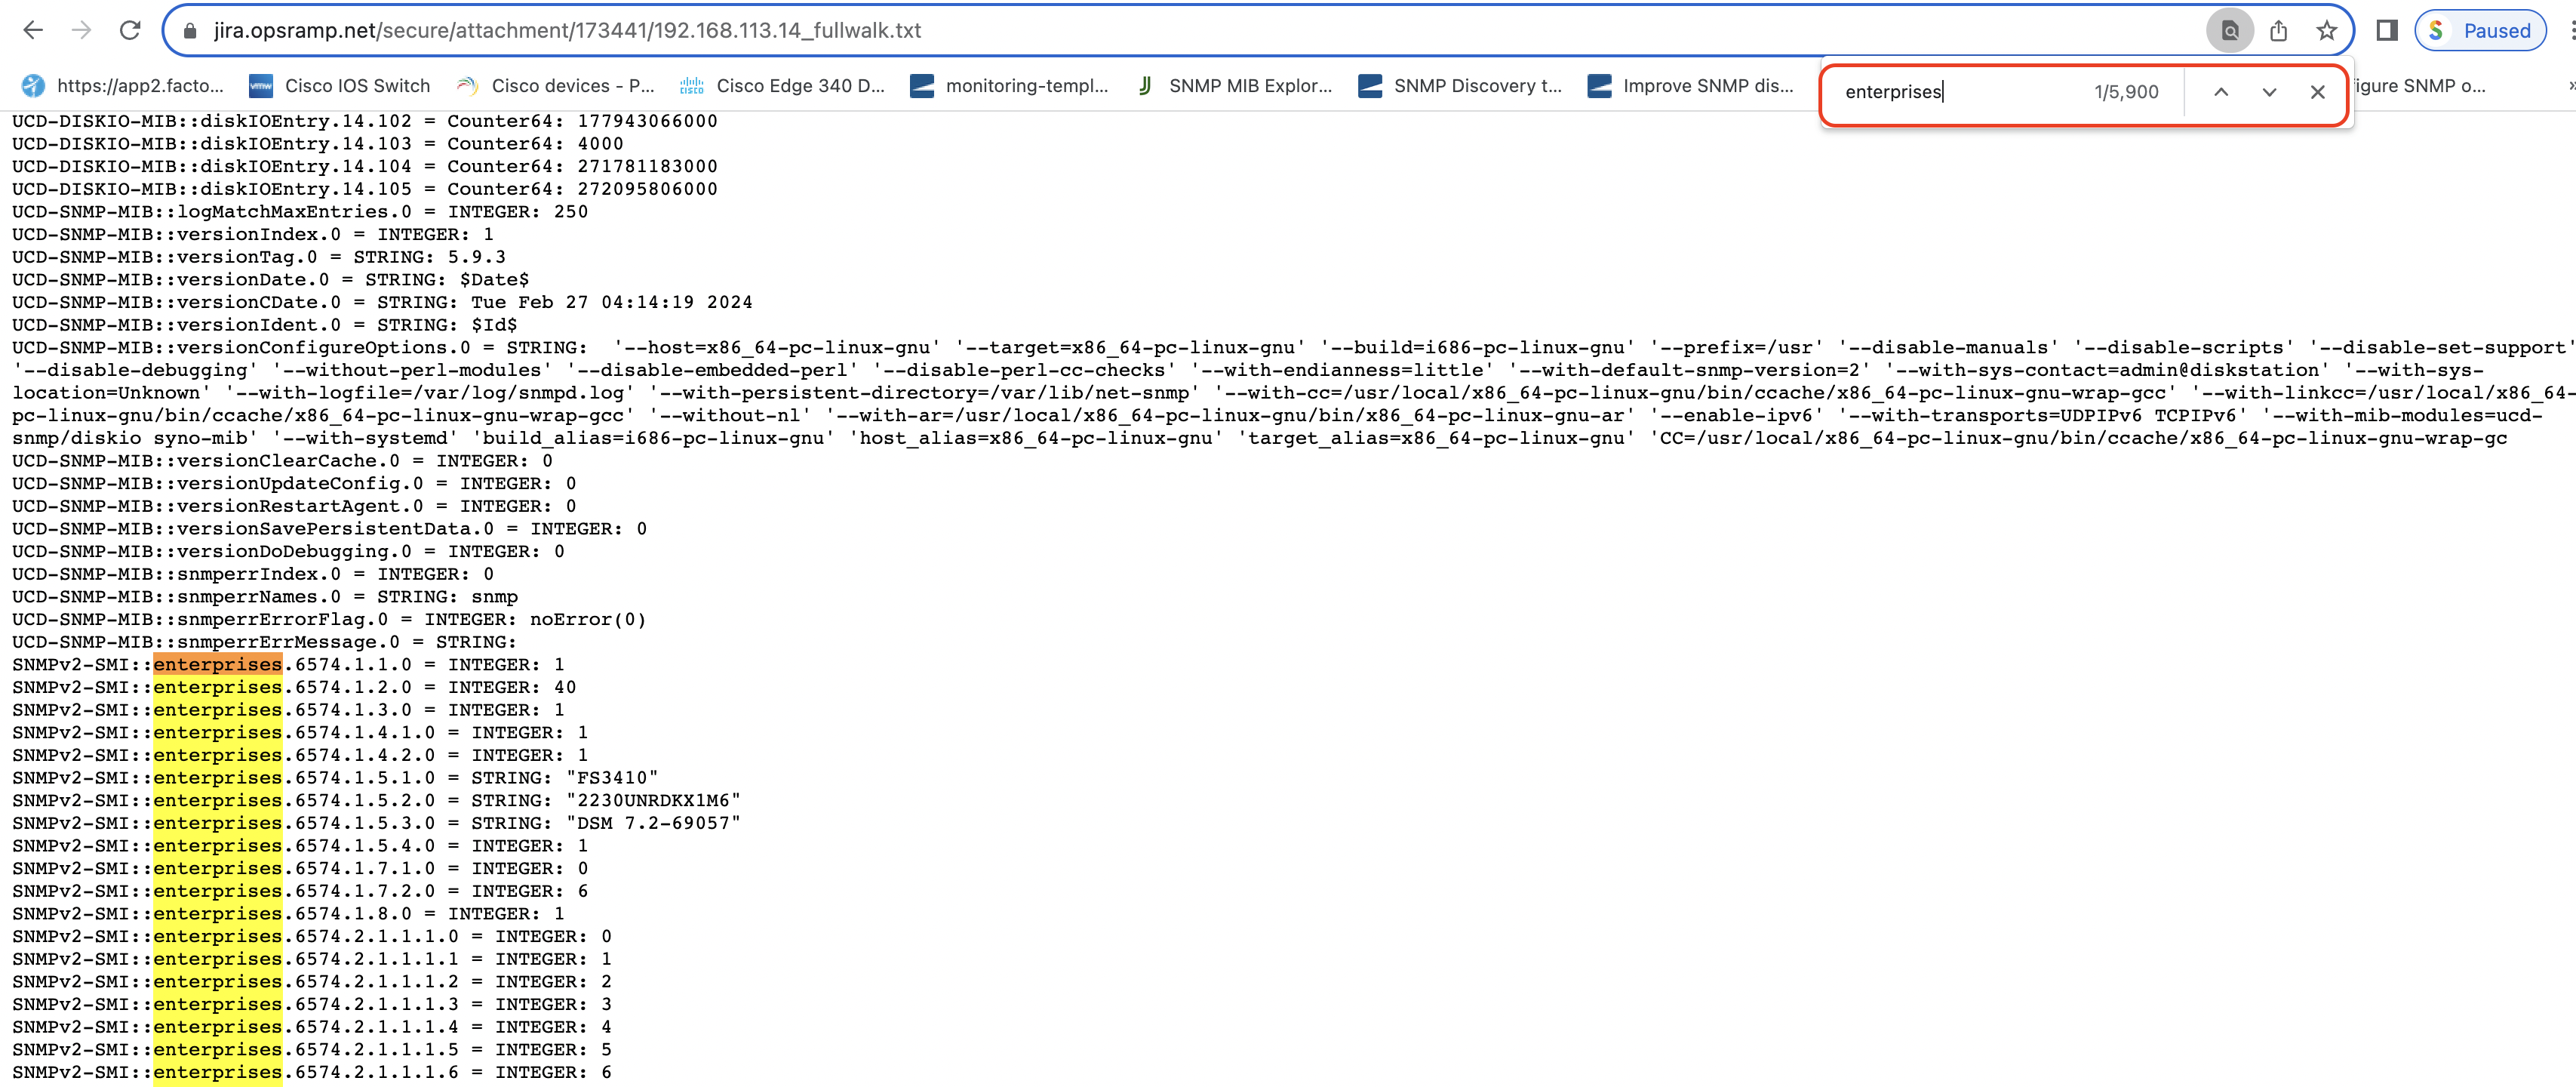
A successful SNMP full walk typically ends with: No more variables left in this MIB View (It is past the end of the MIB tree)
Example: SNMP Walk Output (End of Execution)
SNMPv2-SMI::enterprises.25461.2.1.2.7.4.4.1.5.8 = Counter32: 0
SNMPv2-SMI::enterprises.25461.2.1.2.7.4.4.1.6.1 = INTEGER: 844
SNMPv2-SMI::enterprises.25461.2.1.2.7.4.4.1.6.2 = INTEGER: 0
SNMPv2-SMI::enterprises.25461.2.1.2.7.4.4.1.6.3 = INTEGER: 0
SNMPv2-SMI::enterprises.25461.2.1.2.7.4.4.1.6.4 = INTEGER: 0
SNMPv2-SMI::enterprises.25461.2.1.2.7.4.4.1.6.5 = INTEGER: 0
SNMPv2-SMI::enterprises.25461.2.1.2.7.4.4.1.6.6 = INTEGER: 0
SNMPv2-SMI::enterprises.25461.2.1.2.7.4.4.1.6.7 = INTEGER: 0
SNMPv2-SMI::enterprises.25461.2.1.2.7.4.4.1.6.8 = INTEGER: 0

SNMP-FRAMEWORK-MIB::snmpEngineID.0 = Hex-STRING:
80 00 1F 88 04 30 30 37 39 35 31 30 30 30 33 36
36 39 32 35

SNMP-FRAMEWORK-MIB::snmpEngineBoots.0 = INTEGER: 23
SNMP-FRAMEWORK-MIB::snmpEngineTime.0 = INTEGER: 422365 seconds
SNMP-FRAMEWORK-MIB::snmpEngineMaxMessageSize.0 = INTEGER: 1500

SNMP-FRAMEWORK-MIB::snmpEngineMaxMessageSize.0 =
No more variables left in this MIB View (It is past the end of the MIB tree)
Use Case 3: Long-Running SNMP Walks
If the full walk takes too long, run partial walks instead:
- System walk
- Entity walk
- Enterprise walk
See How to execute SNMPWALK for details.
Use Case 4: “Component OID is not responding” Error
This error indicates the template’s OIDs aren’t supported on your device, suggesting an incorrect template selection. Check your SNMP configuration on the end device.
Use Case 5: How to verify if a specific device model is supported for monitoring in OpsRamp?
To verify monitoring support in the OpsRamp UI, an SNMP full walk of the device is required.
Monitoring Support(Recommend Templates):
As an initial step,
- Gateway Template Details using a combination of make, OS, device type, and model:
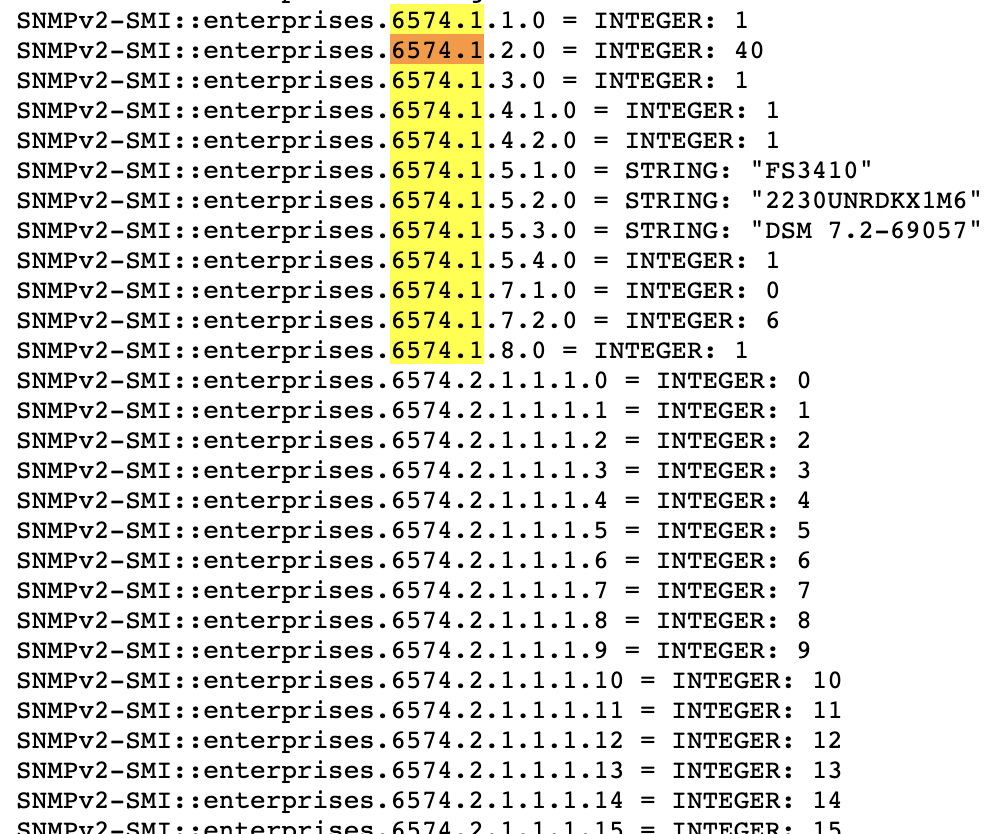
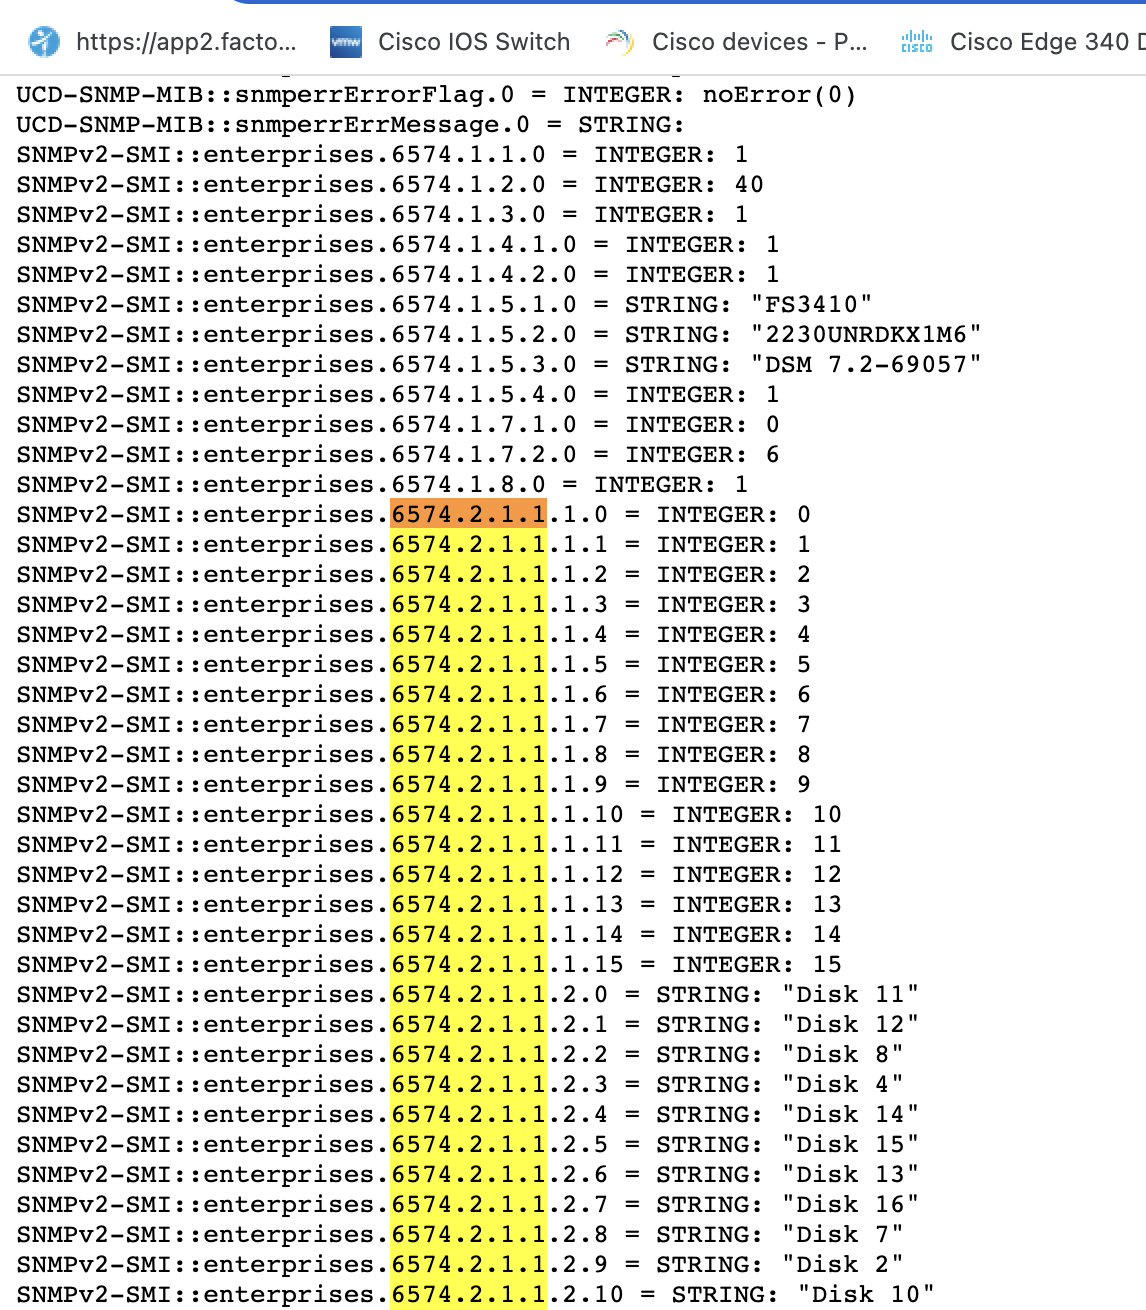
- Vendor-specific templates can be identified by analyzing the enterprise walk.
- Starting from the enterprise OID, copy the common OID and navigate to: Setup » Monitors » Search » Advanced » Description, and search using the enterprise OID.
Example:1
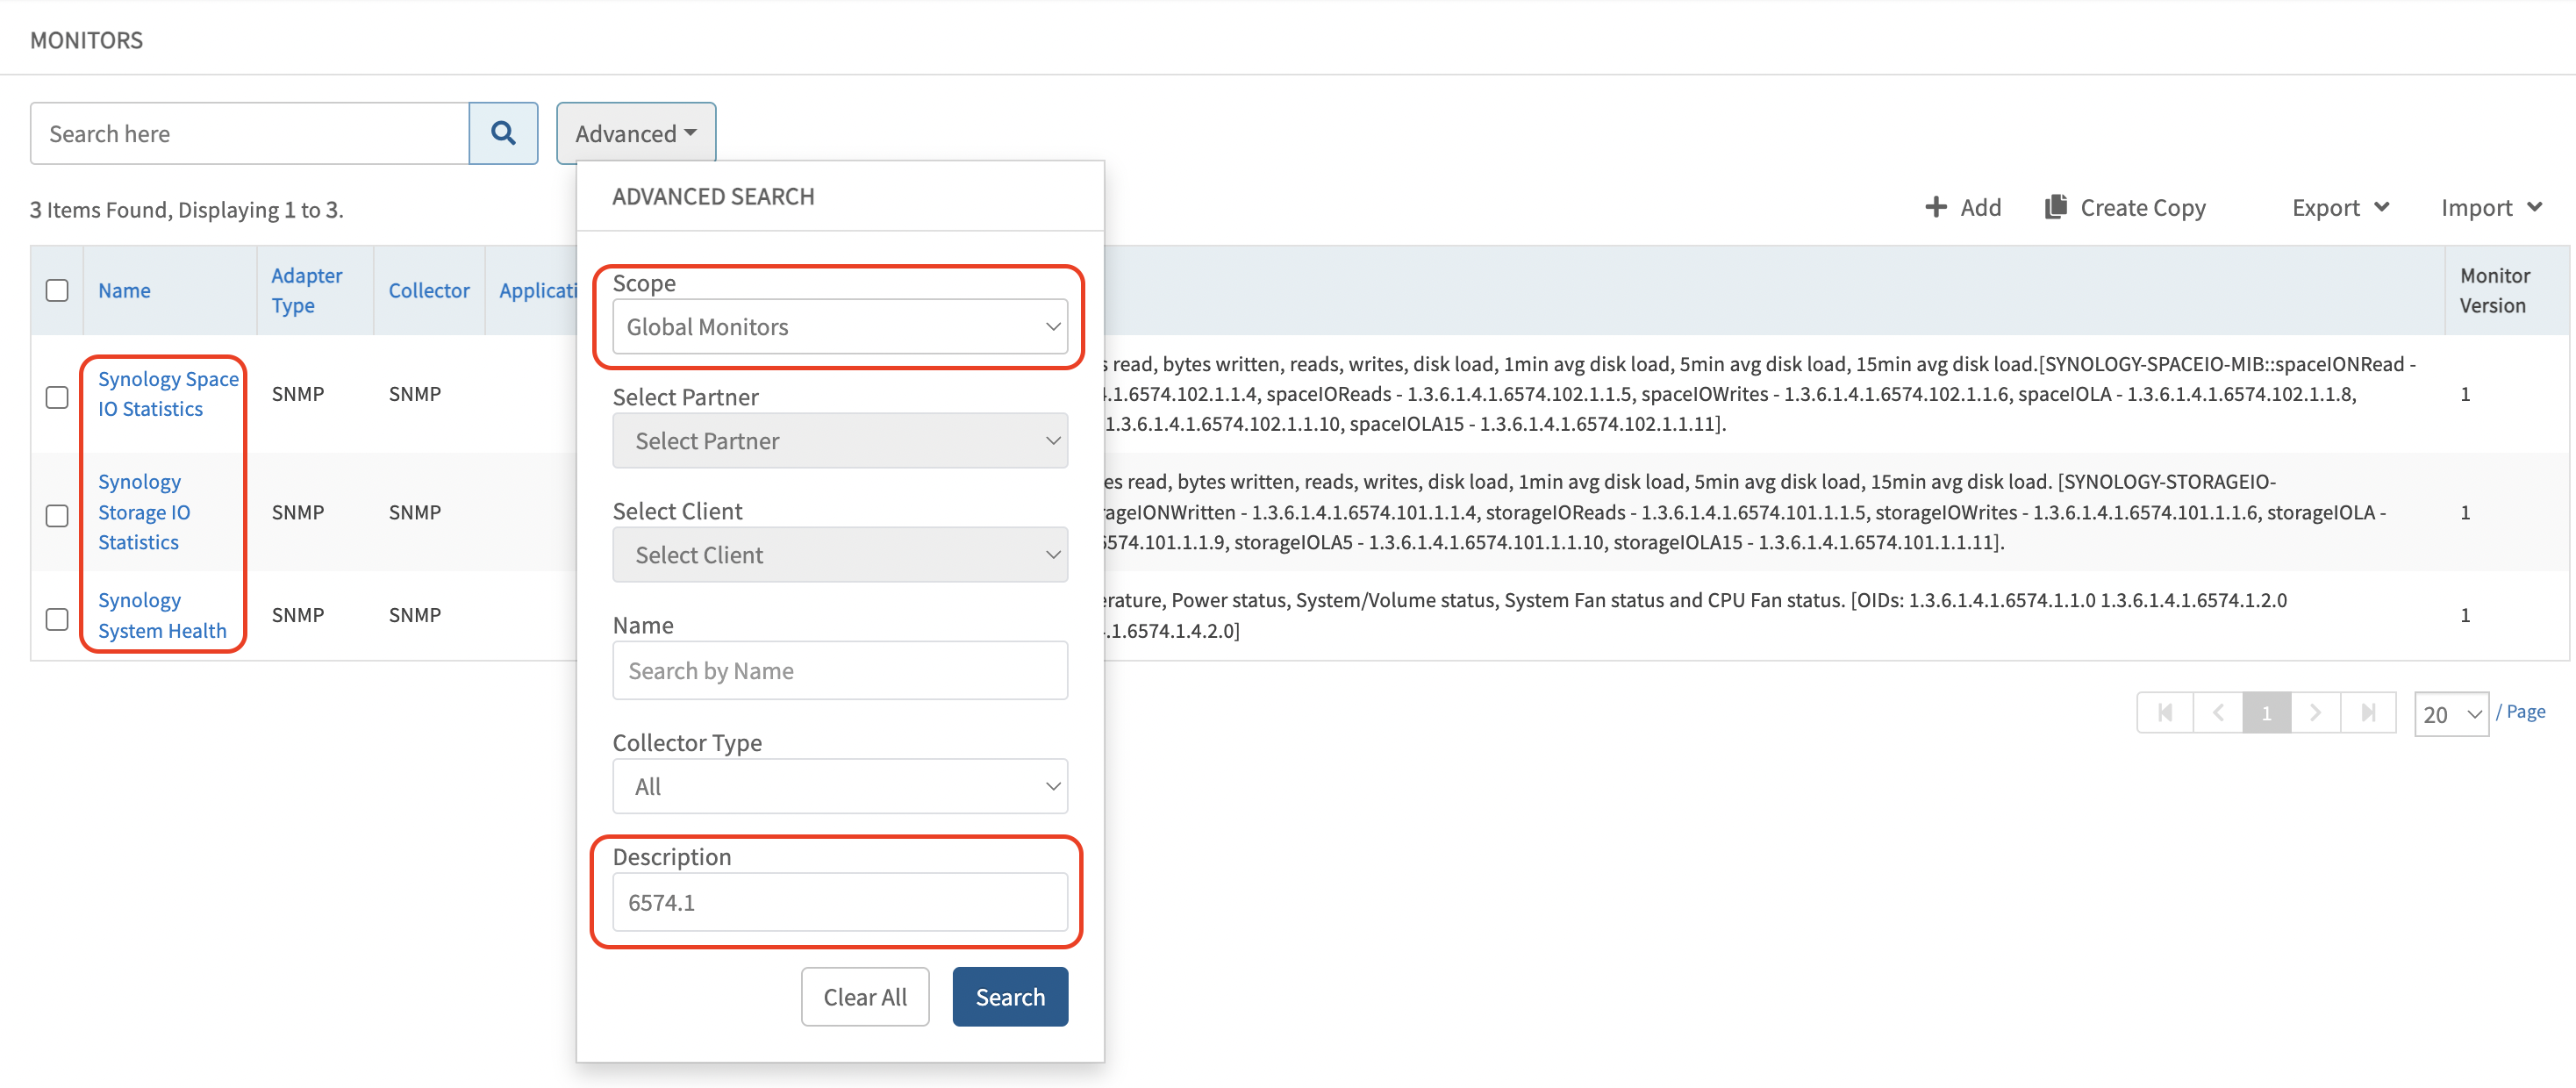
Example:2
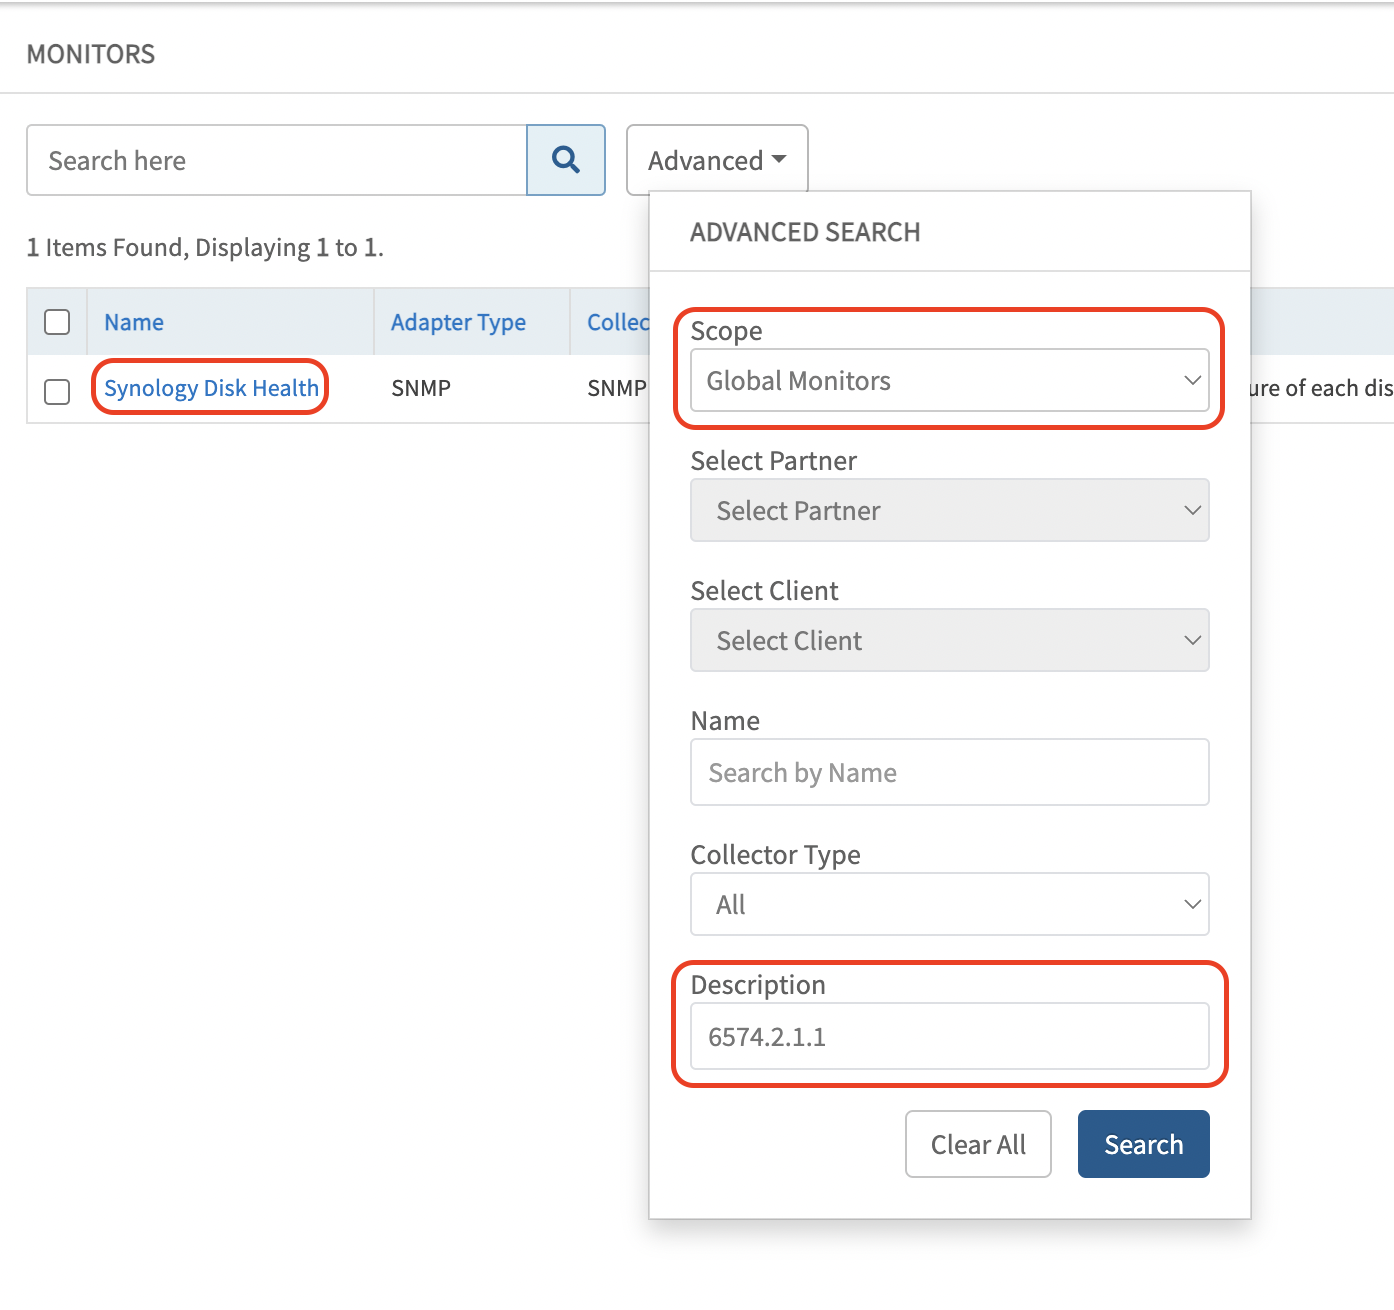
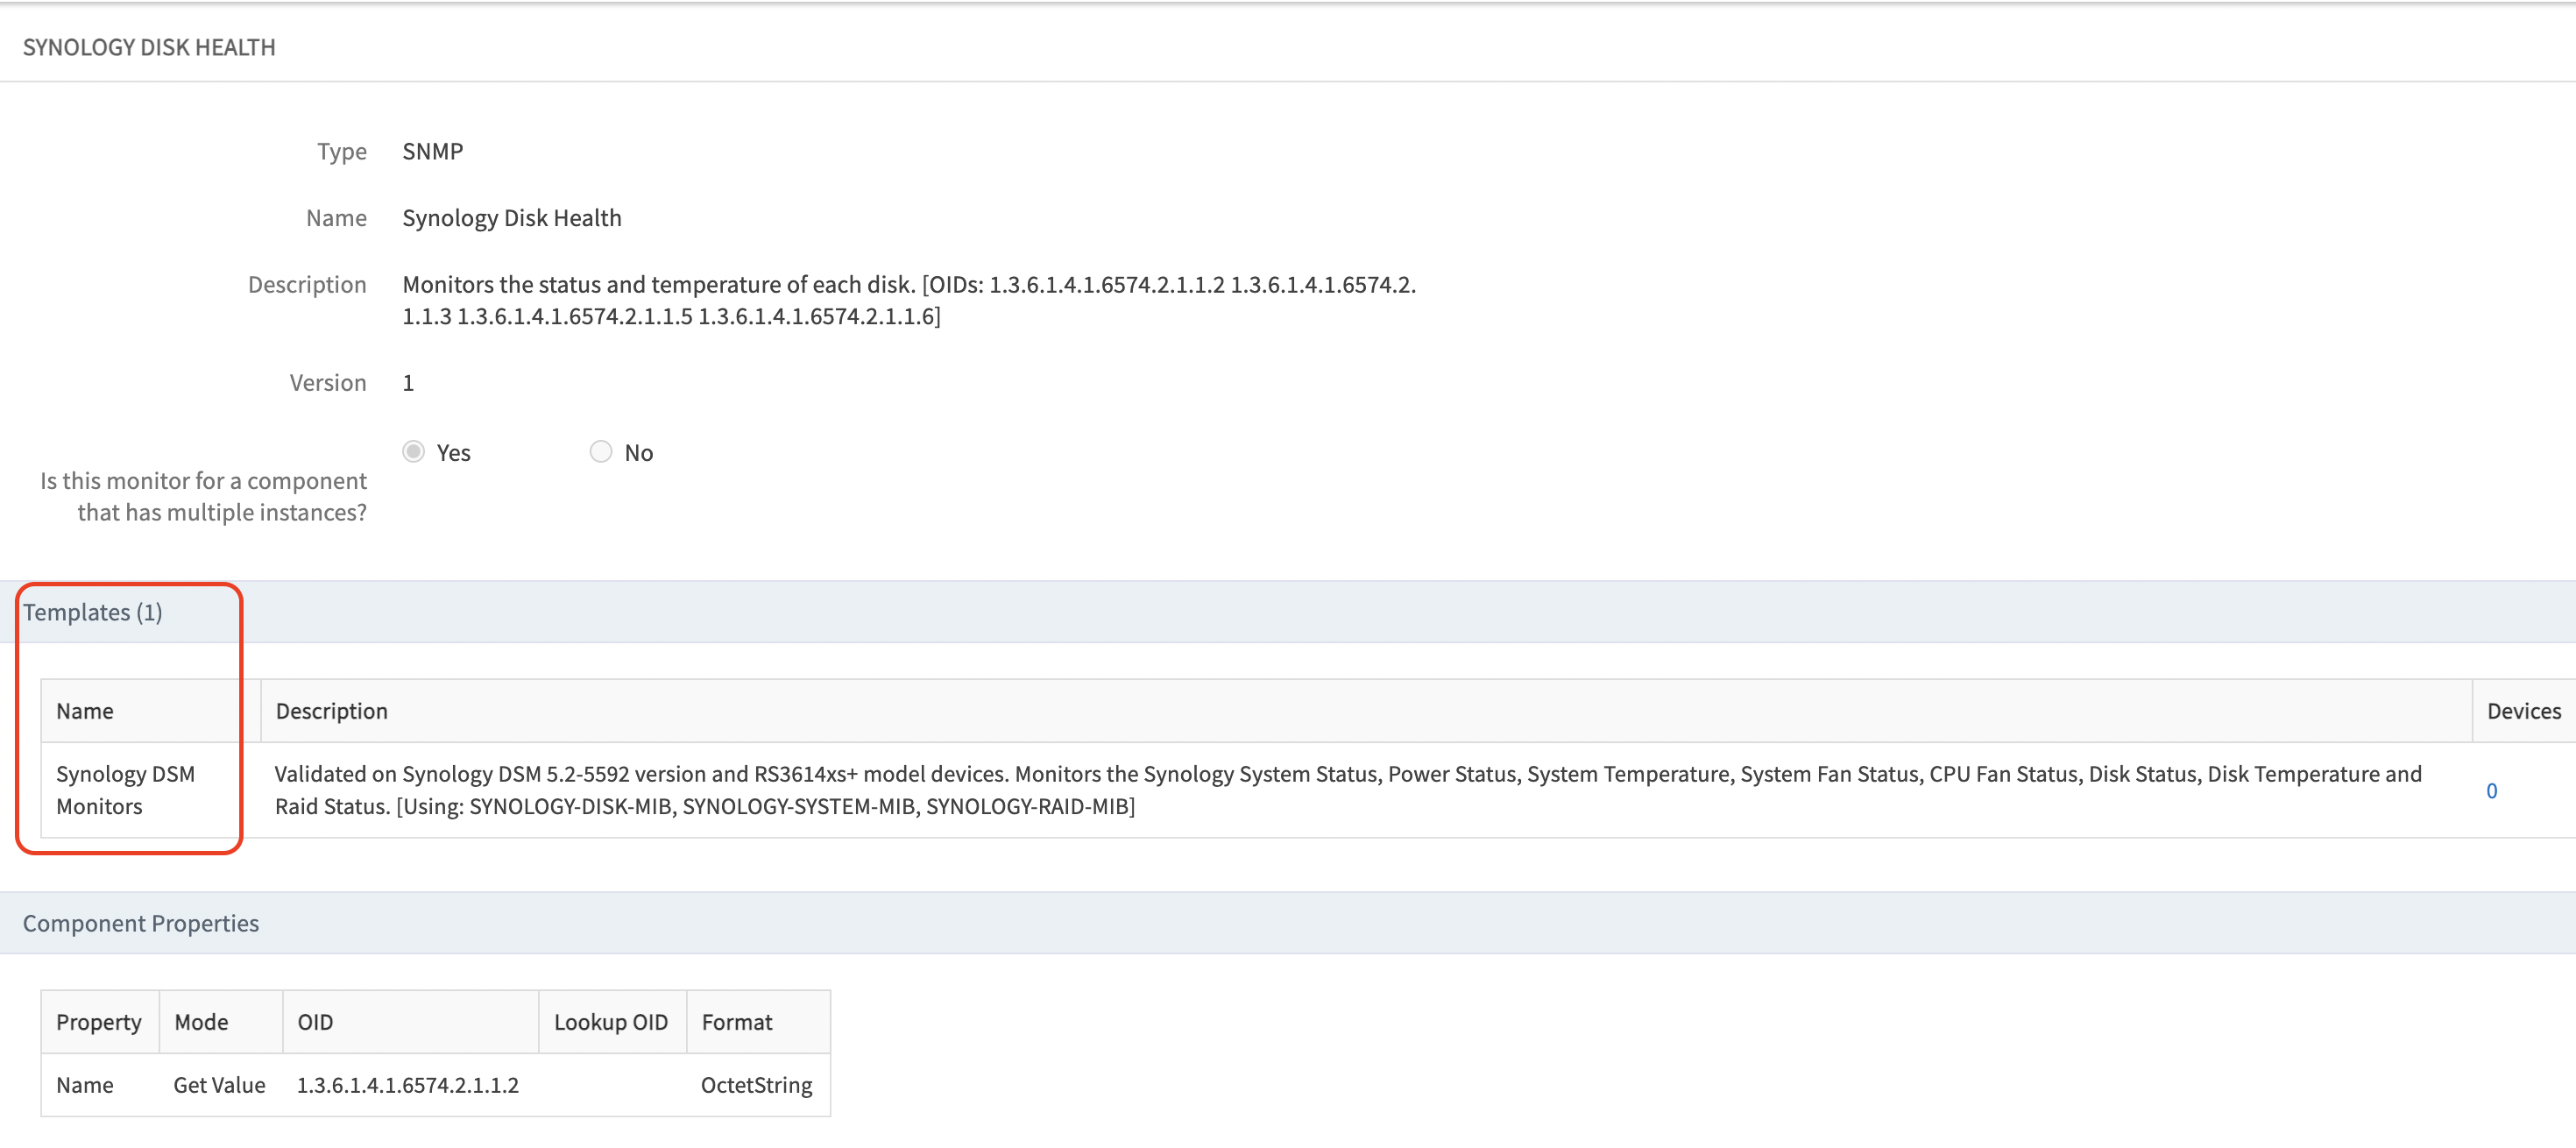
- Select the relevant monitor from the results. The corresponding template name can be identified within the monitor.
- For generic templates (such as interface and sysUptime templates), use the remaining SNMP walk (excluding enterprise OIDs) and verify in the OpsRamp UI.
Use Case 6: Applied Time Not Updating After Template Assignment
If the applied time is not updated after template assignment and the field remains empty, the template configuration has not been pushed to the gateway from OpsRamp. Contact the OpsRamp support team to resolve this issue.
Use Case 7: Interface Details Not Visible in Interface Tab
If interface details are unavailable in the Interface tab despite being in the monitoring template, re-discover the device first. If the issue persists, enable debug logs and analyze the data.
Steps to enable debug logs:
- Connect to gcli:
vgprompt#gcli + enter
- Enable logs using the following command:
gcli@gateway>nd log on <30 no of mins>
Example:
gcli@gateway>nd log on 30
This enables the following logs temporarily for 30 minutes:
      ntwrk.disc on A Timer with timeout 30min has created to revert the val to off
      snmp.disc on A Timer with timeout 30min has created to revert the val to off
      snmp.topology on A Timer with timeout 30min has created to revert the val to off
      disc.response on A Timer with timeout 30min has created to revert the val to off
      gcli@gateway>
- Perform device discovery again after running the following command:
tail -f /var/log/app/vprobe.log
- Check discovery data in
/var/log/app/tmp/:
  cd /var/log/app/tmp/
  ll network-discovery-chunk-*.json
Note
Discovered devices send their information to the cloud, and the data is recorded in log files located in the/var/log/app/tmp/ directory.File names follow the format:network-discovery-chunk-<timestamp>.json
To view the most recent files, run the following commands:
cd /var/log/app/tmp/ folder
ll network-discovery-chunk-*.json
Customer can share the vprobe.log and network-discovery-chunk-*.json files with us for further troubleshooting.
Use Case 8: Getting Stale Alerts on Network Switches
Alerts are generated based on SNMP responses from the end device. Verify the SNMP walk response when observing stale alerts. Refer to Use Case 9: Templates Applied but No Metric Data Collection for more information.
Use Case 9: Templates Applied but No Metric Data Collection
After applying new templates, metric data may not be collected on devices. For example, if HP Procurve Switch - G2 is applied without data collection, verify that the template OIDs are supported on the end device.
Steps to verify OID support:
- Identify the monitor names associated with the applied template.
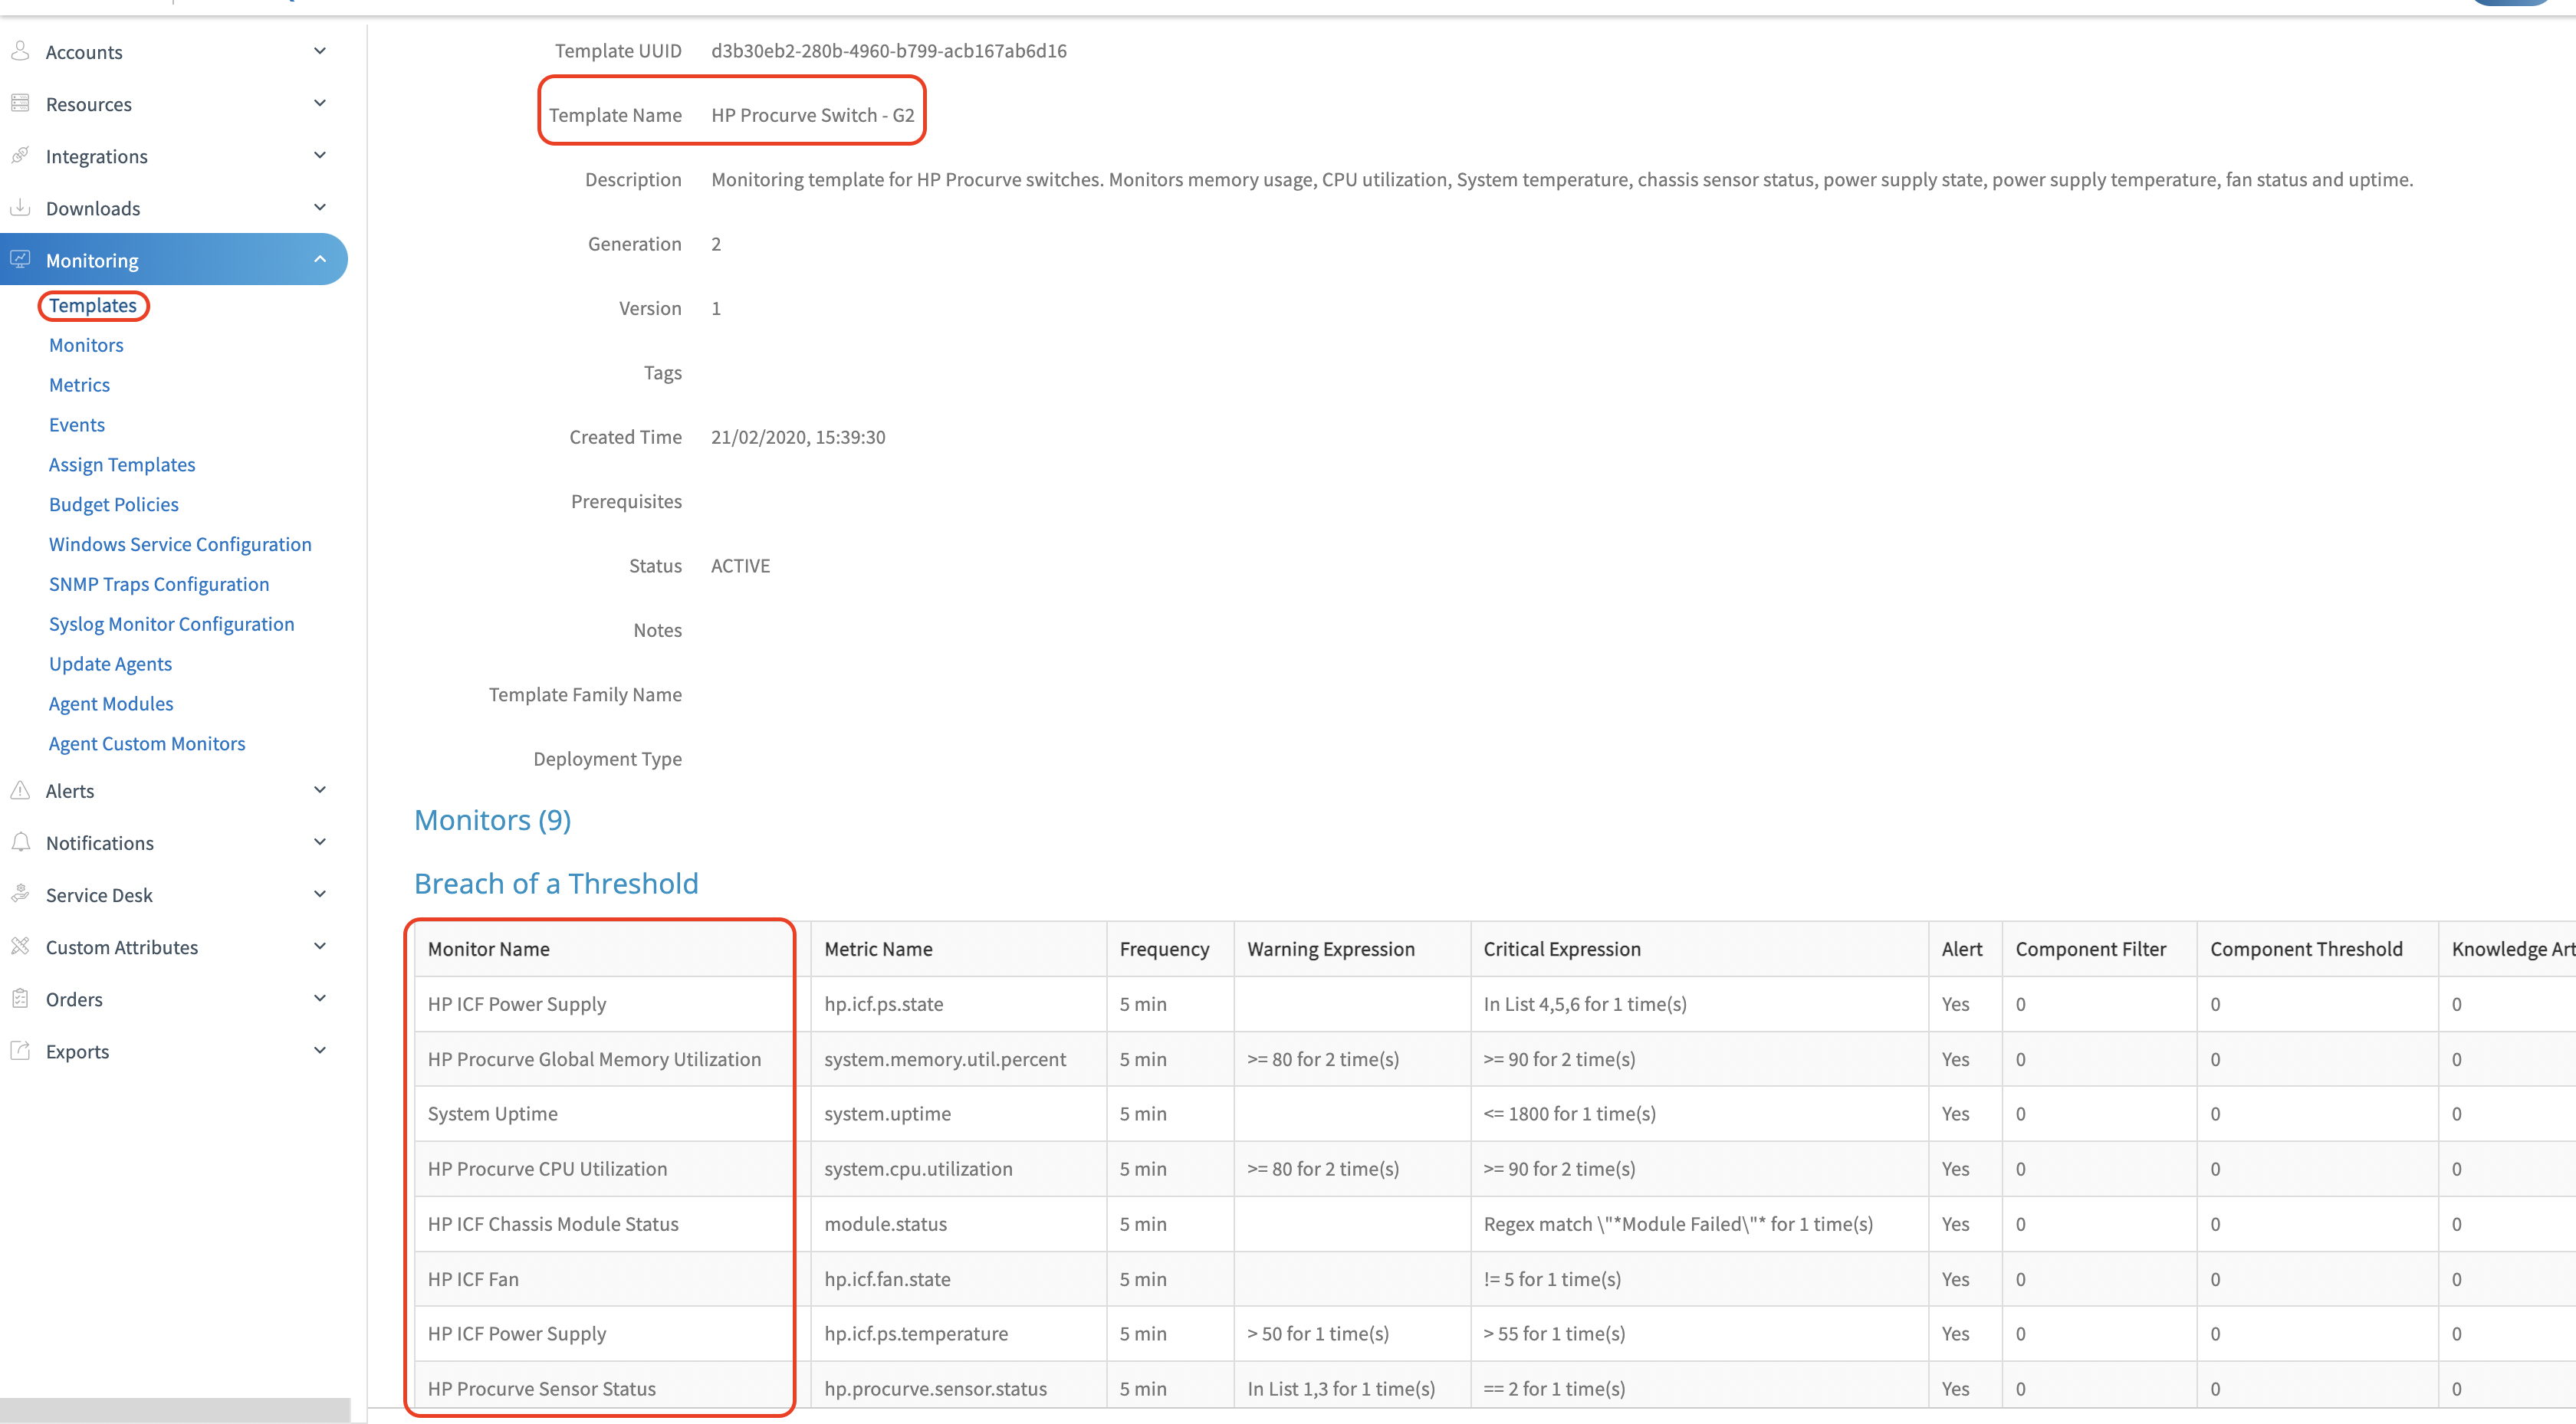
- Using the monitor names, check the OID details in the monitor description. Run an SNMP walk on the identified OID to verify whether it is supported on the end device. If the OIDs are not supported on the device, data will not be collected for the corresponding template or monitor.
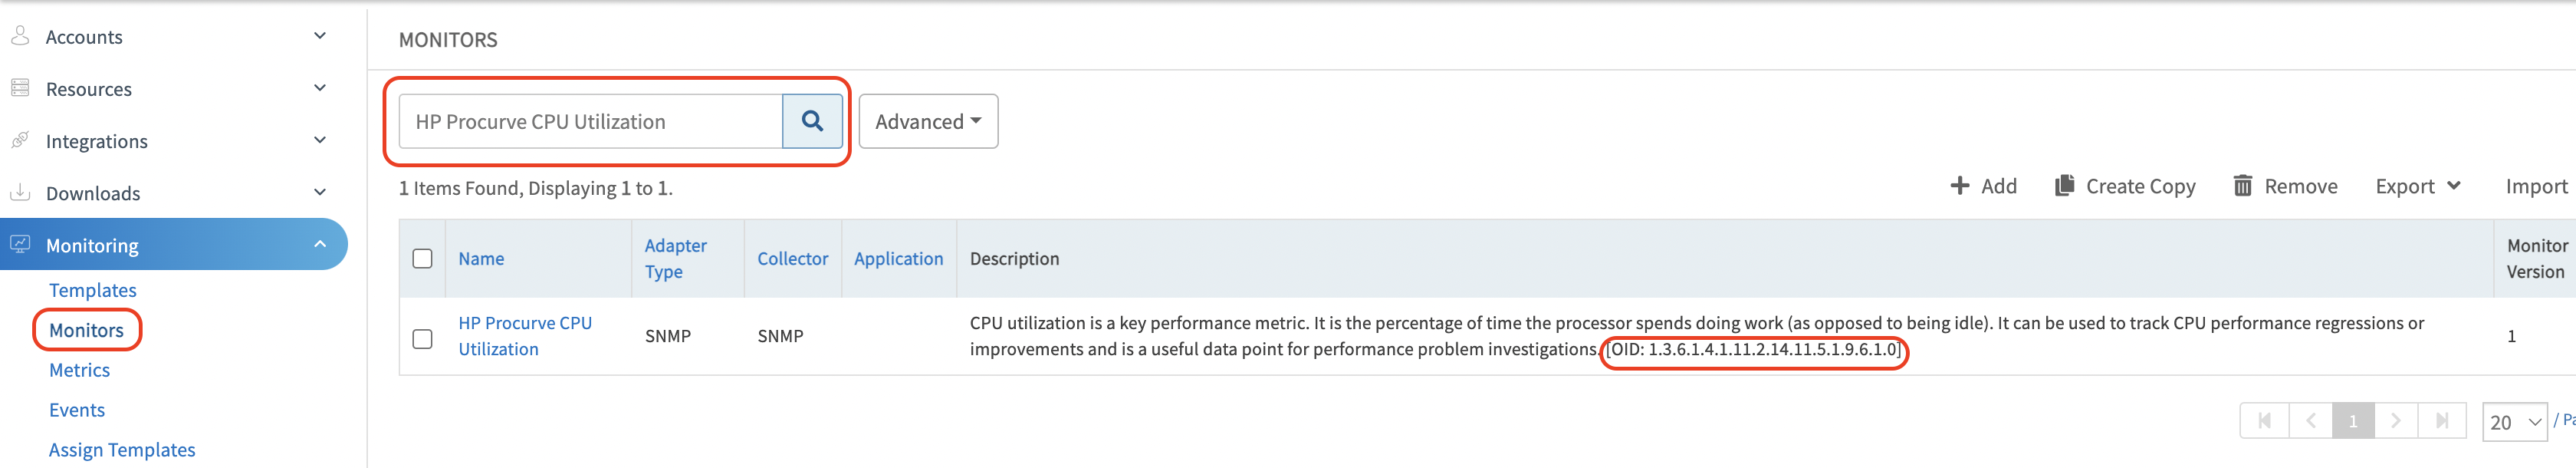
SNMP Walk command
snmpwalk -v2c -c public <IP Address> 1.3.6.1.4.11.2.14.11.5.1.9.6.1.0
Verify SNMP timeout alerts associated with the device.
Enable debug logs on the gateway and review logs:
Login to the gateway CLI with sudo su and enter gcli:
  sudo su
  gcli
- Add the following flag to enable logs:
flag add nd log on 30
- Exit from gcli using the exit command:
exit
- Grep the vprobe logs:
tail -100f /var/log/app/vprobe.log
Trigger Get Latest Metrics and review the vprobe logs.
Enable tcpdump to capture SNMP request/response packets:
tcpdump -vv -i any "host 10.176.168.64 and port 161" -s 3000 -w 10.176.168.64-dp-dump.pcap
Note
If the template polling frequency is set to 5 minutes, run the tcpdump command for at least 10 minutes (minimum of two polling cycles) to capture sufficient data.
If the issue persists after performing all the above steps, raise a case with the OpsRamp support team and provide:
- SNMP walk of the device
vprobe.logtcpdump files
Use Case 10: Recovery Alert Missing for Resources
As per alert uniqueness logic, the component name must be the same in both Critical and OK alerts.
Example:
Critical : Switch 1 - Power Supply B
OK       : Switch 1 - Power Supply B
In certain cases, devices return different component names for Critical and OK alerts. As a result, the recovery alert is not appended to the critical alert, and the alert remains unresolved.
Observed in the following Cisco device models:
- Catalyst 3750
- Catalyst 3650-48PS
- WS-C3850-24U-E
- Catalyst 9300-48T Stack
- Catalyst 9500
Example:
Critical : Switch 1 - Power Supply B, Shutdown
OK       : Switch 1 - Power Supply B, Normal
Critical : Sw2, PS1 Faulty
Critical : Sw1, PS1 Faulty, RPS NotExist
Solution:
Develop an alternate template where the component name is replaced with index values.
As per OpsRamp alert uniqueness design, the hostname, metric, and component must be identical for both Critical and OK alerts to ensure proper alert correlation and deduplication.
Use Case 11: Applied Templates and Metrics Not Populating Data
In this scenario, first verify whether there are any SNMP timeout alerts on the device.
An SNMP full walk is required for validation. Once the full walk is available, verify whether the OIDs used in the template are supported in the walk.
Steps to verify OID support:
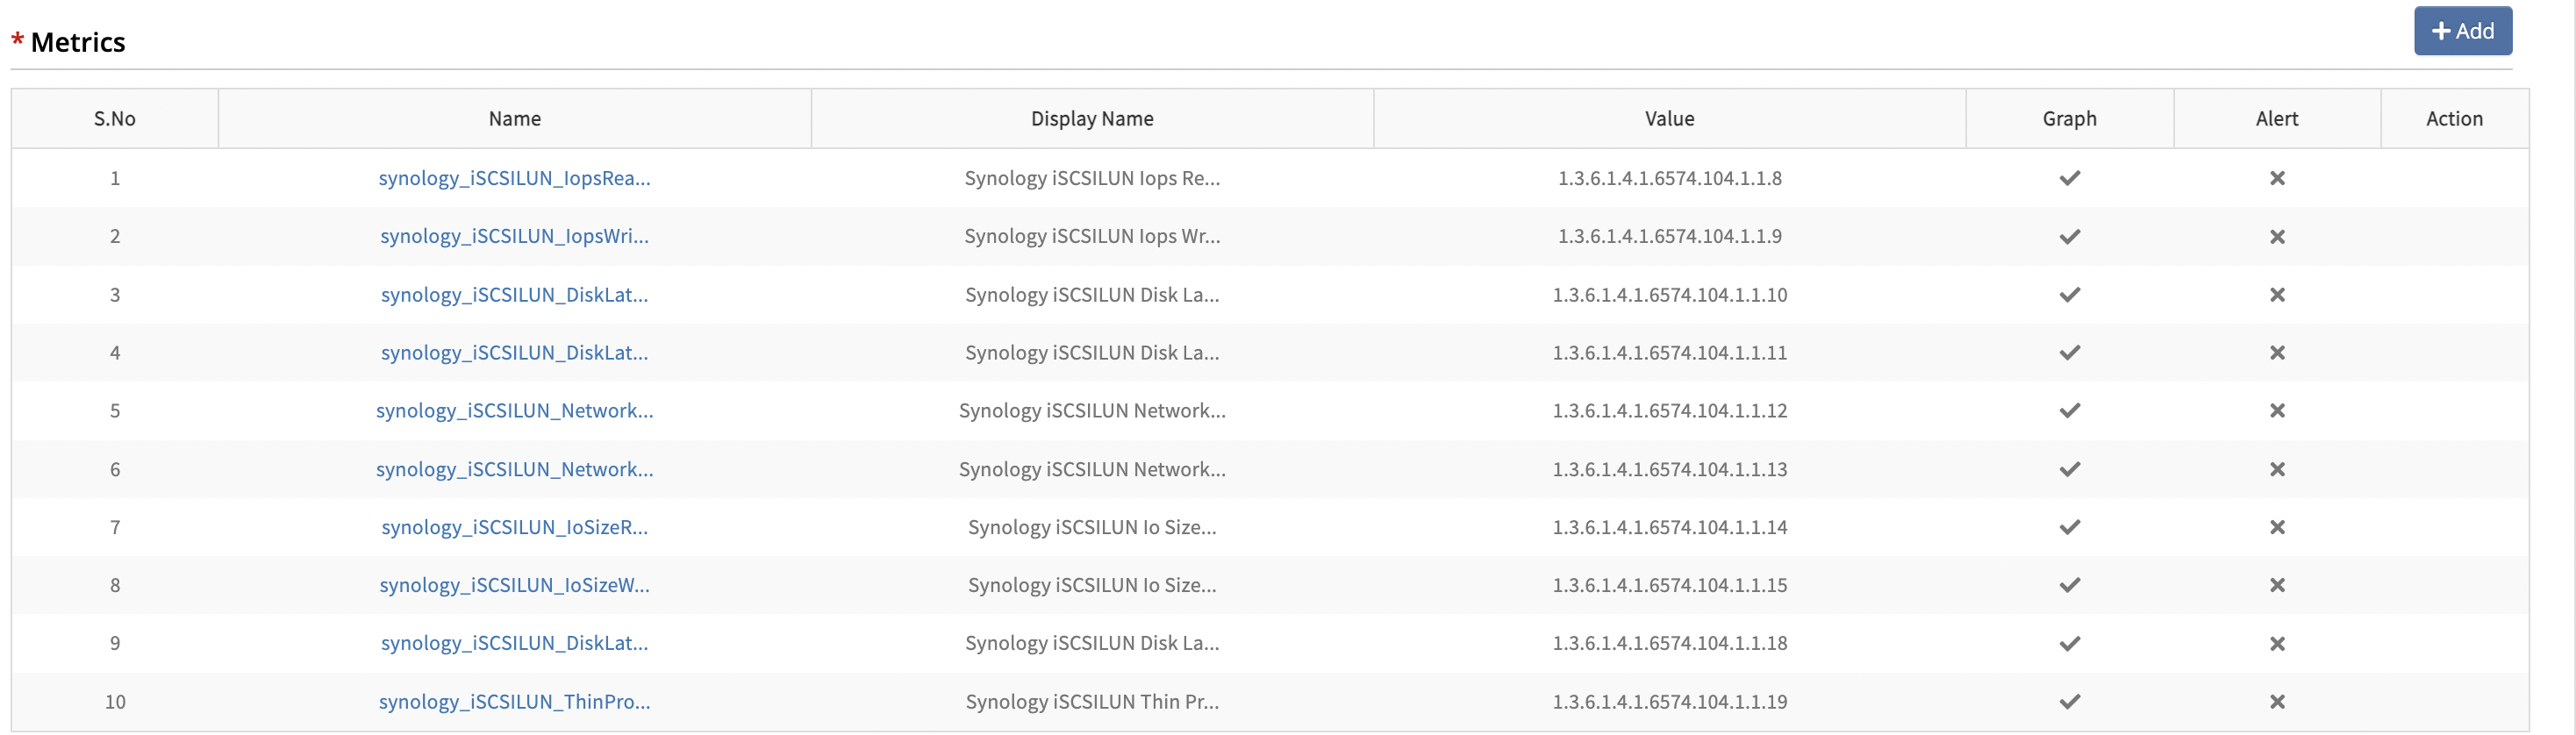
- If it is a global template, create a copy of the template. Within the copied template, identify the monitor names. Open or edit each monitor to view the metrics.
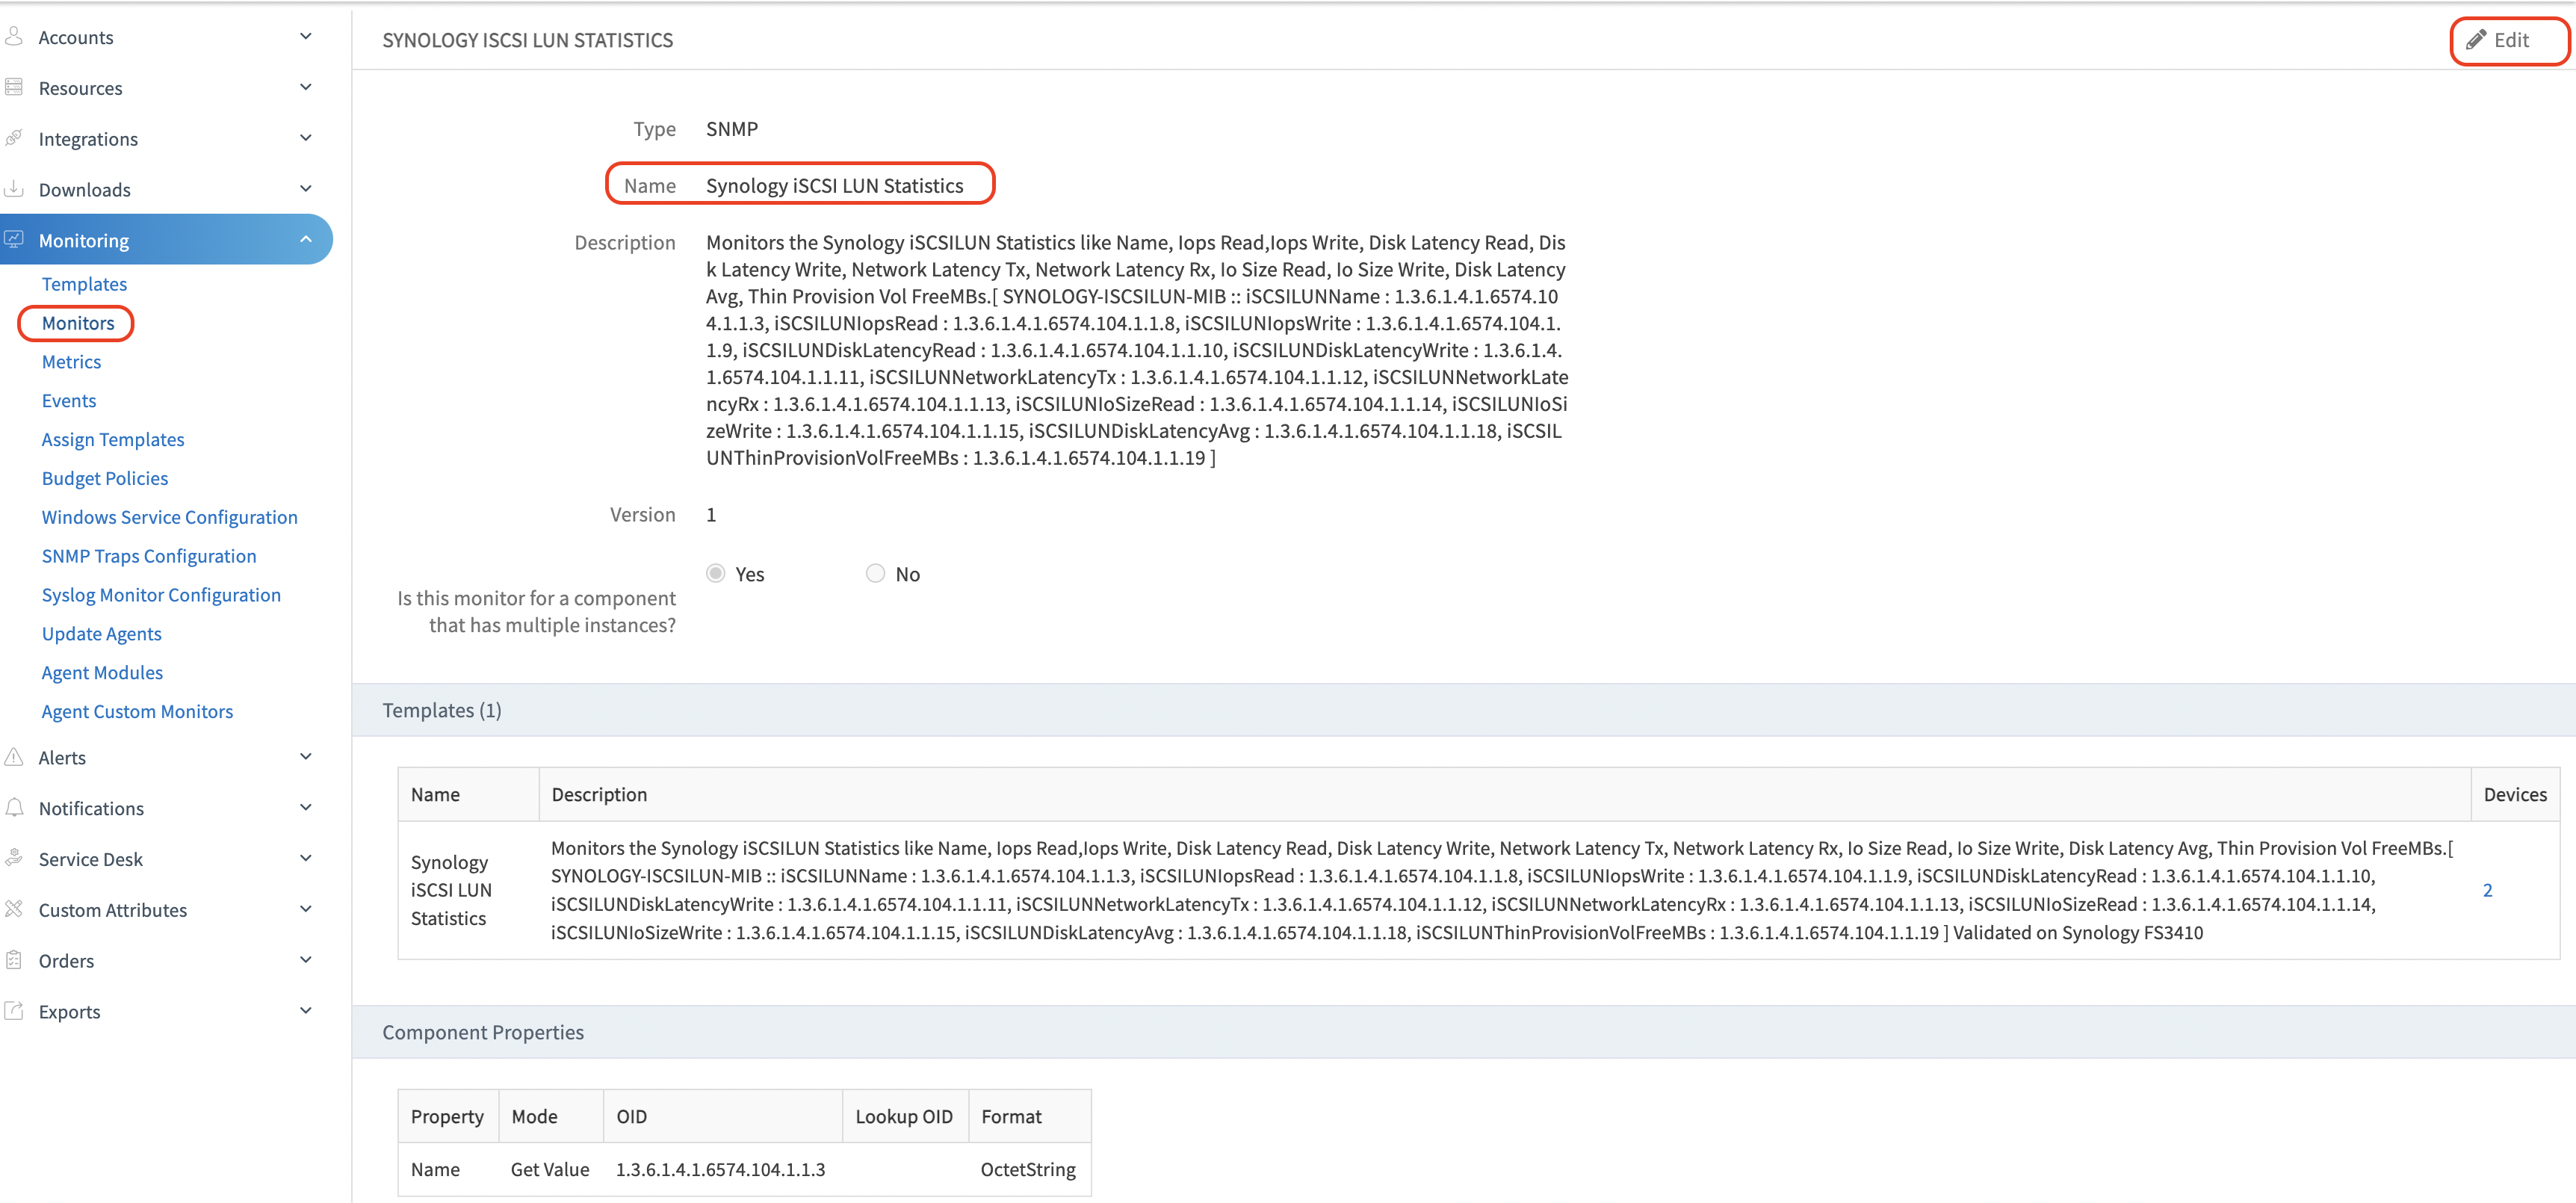
- Click Edit to view the metrics. Navigate to the Metrics section to find the OID details.
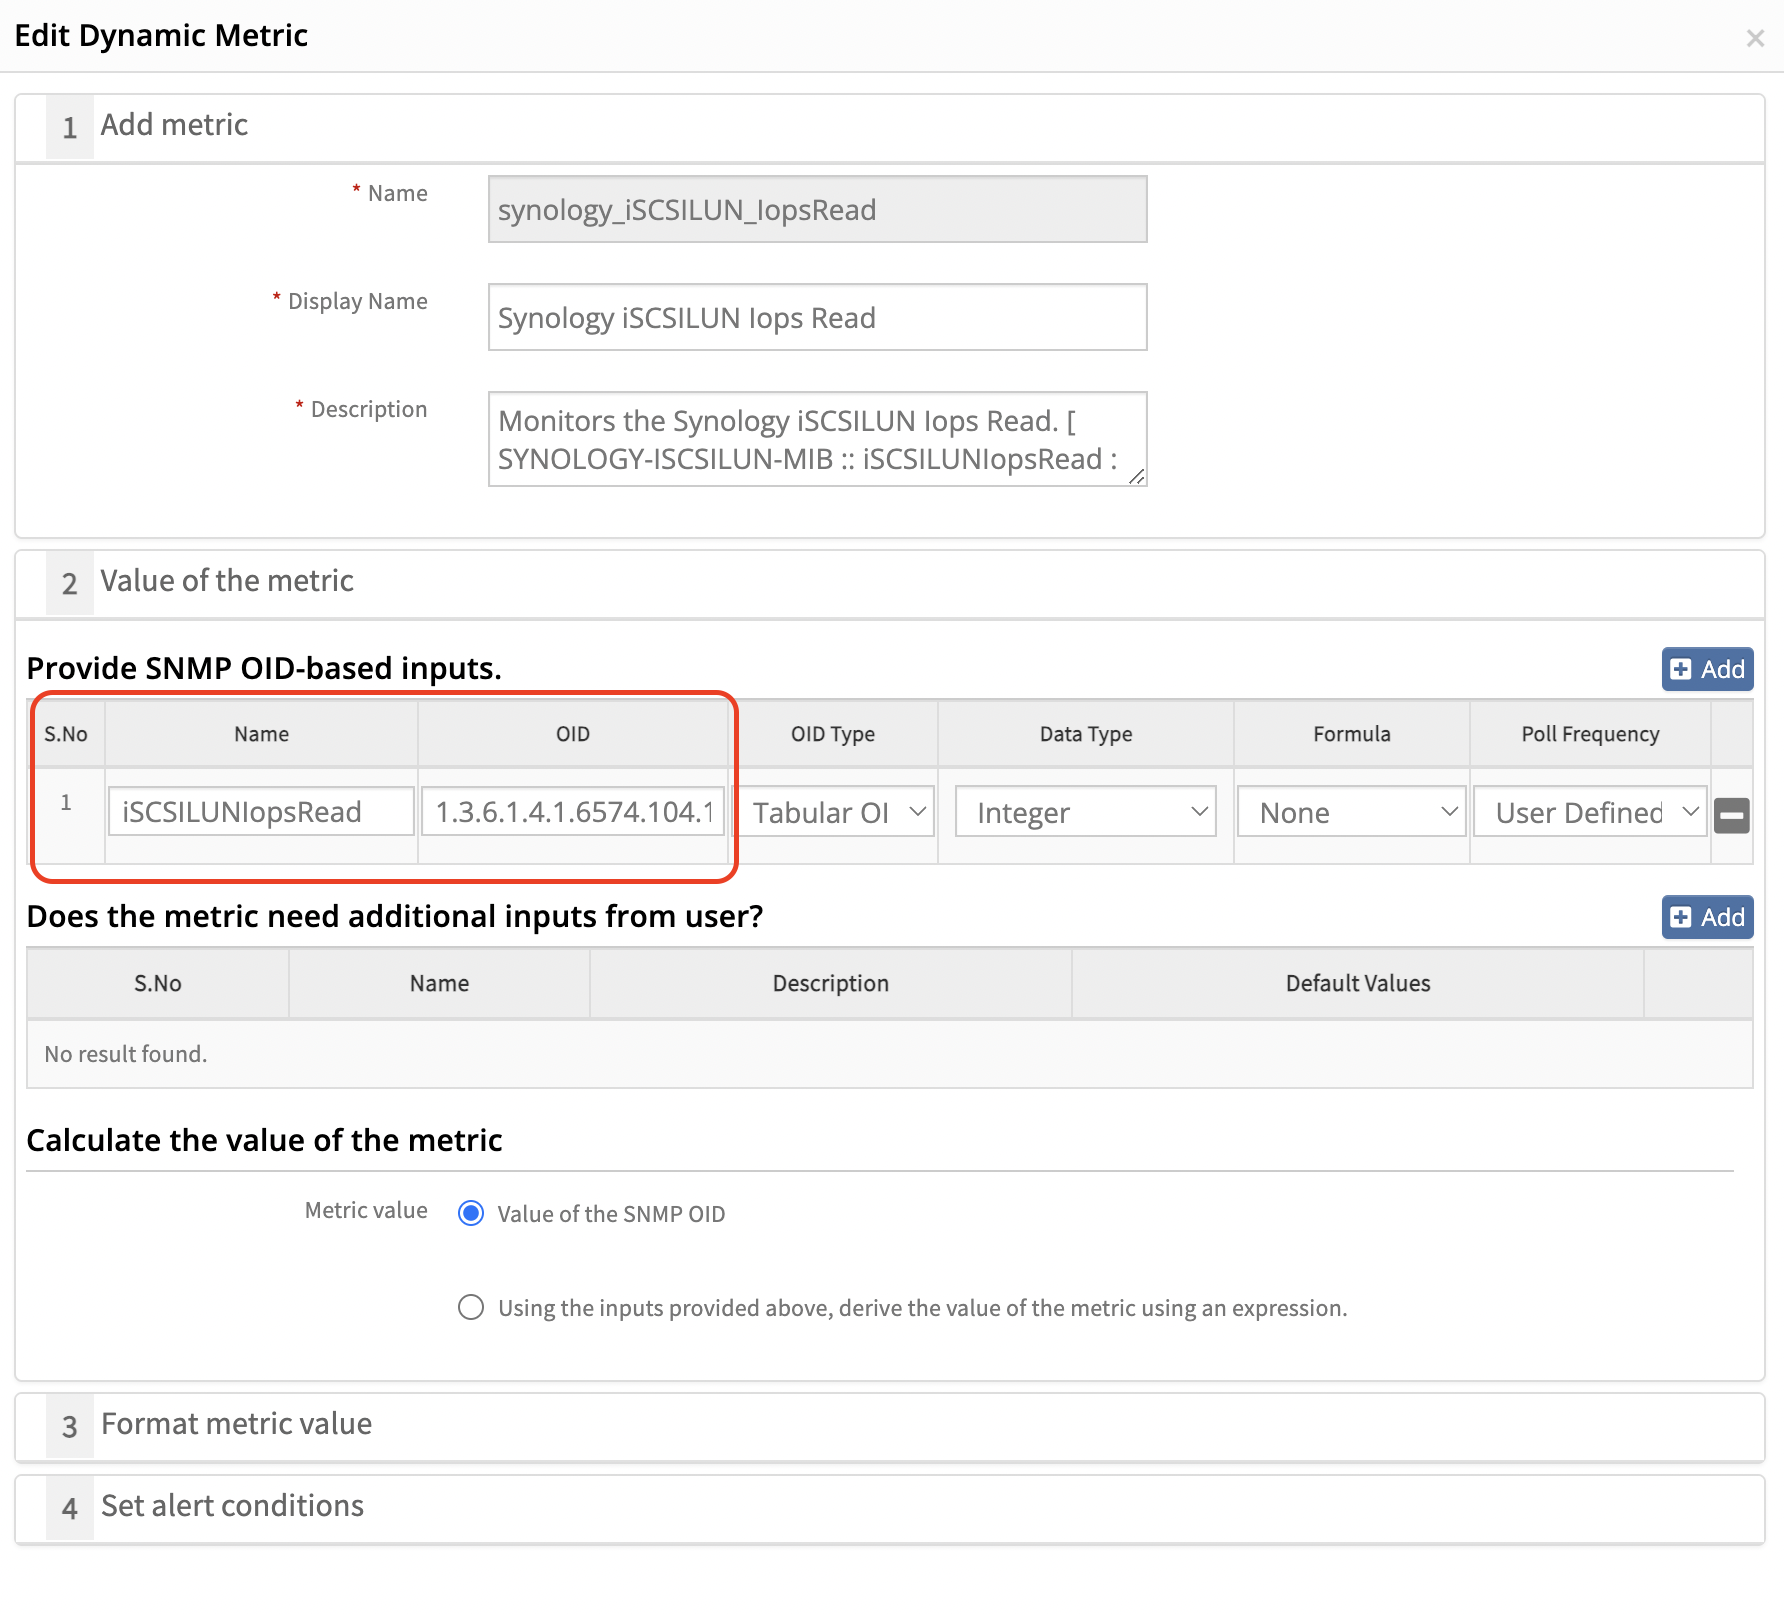
Copy the OID and search for it in the SNMP walk file. If the OID is not found, search using the object name instead.
Ensure that the OID is copied starting from the enterprise OID and then searched in the SNMP walk file.
Example OID: 1.3.6.1.4.1.6574.104.1.1.8
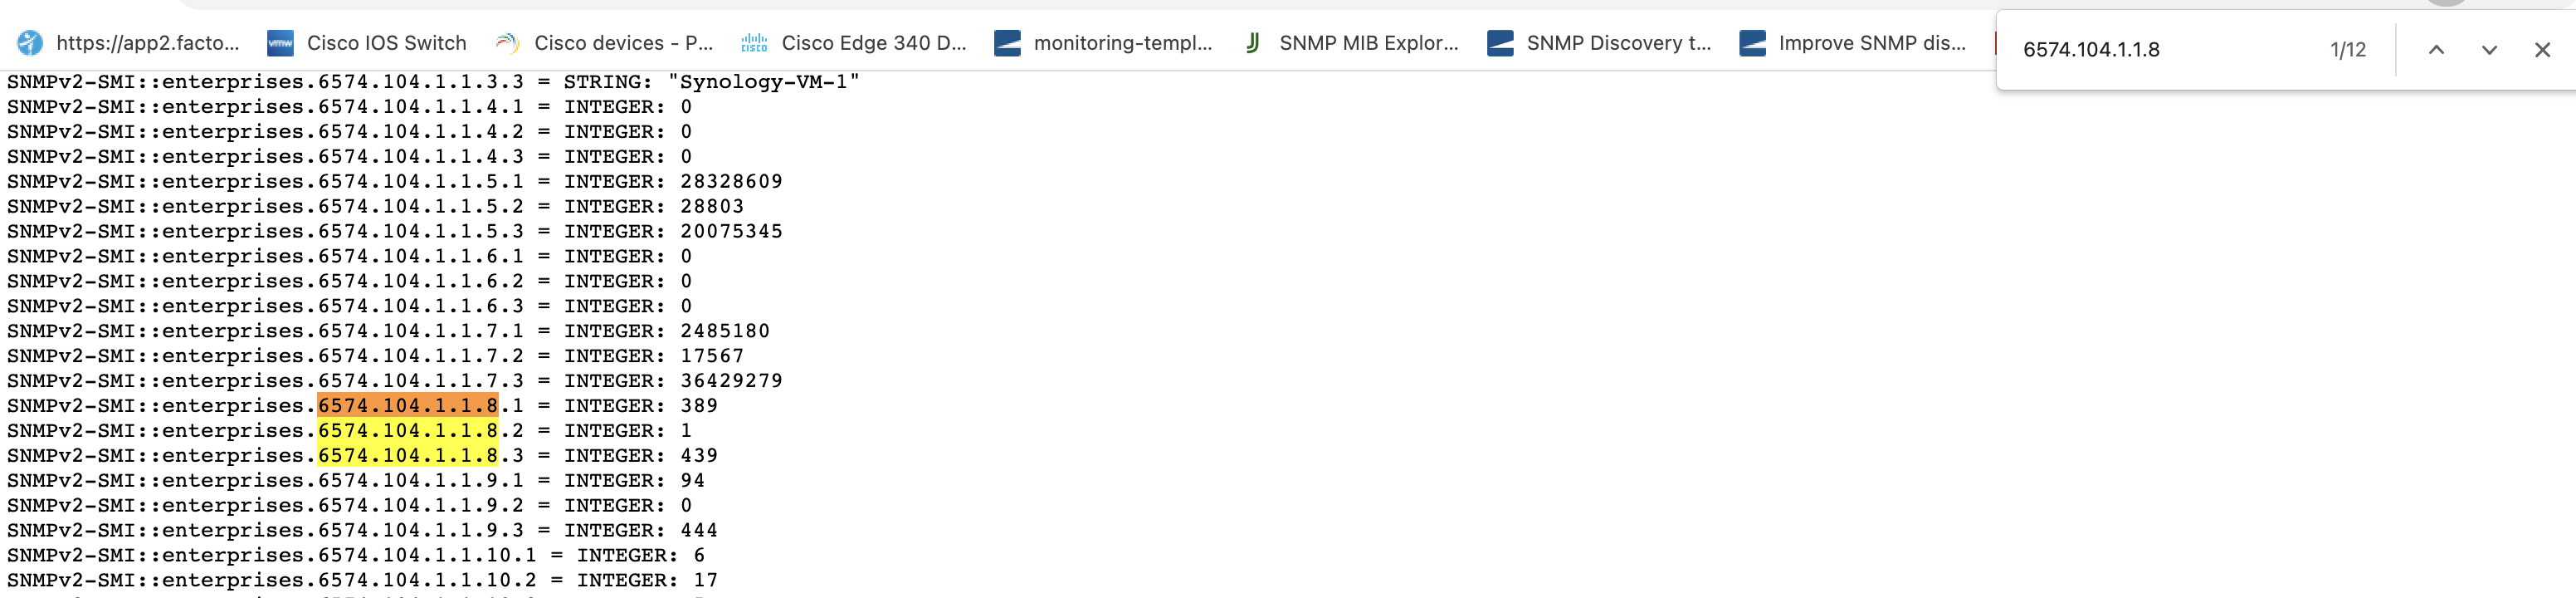
If the OIDs are not supported on the device, data will not be collected for the corresponding template or monitor. If the OIDs are supported but data is still not being collected, raise a case with the OpsRamp support team.
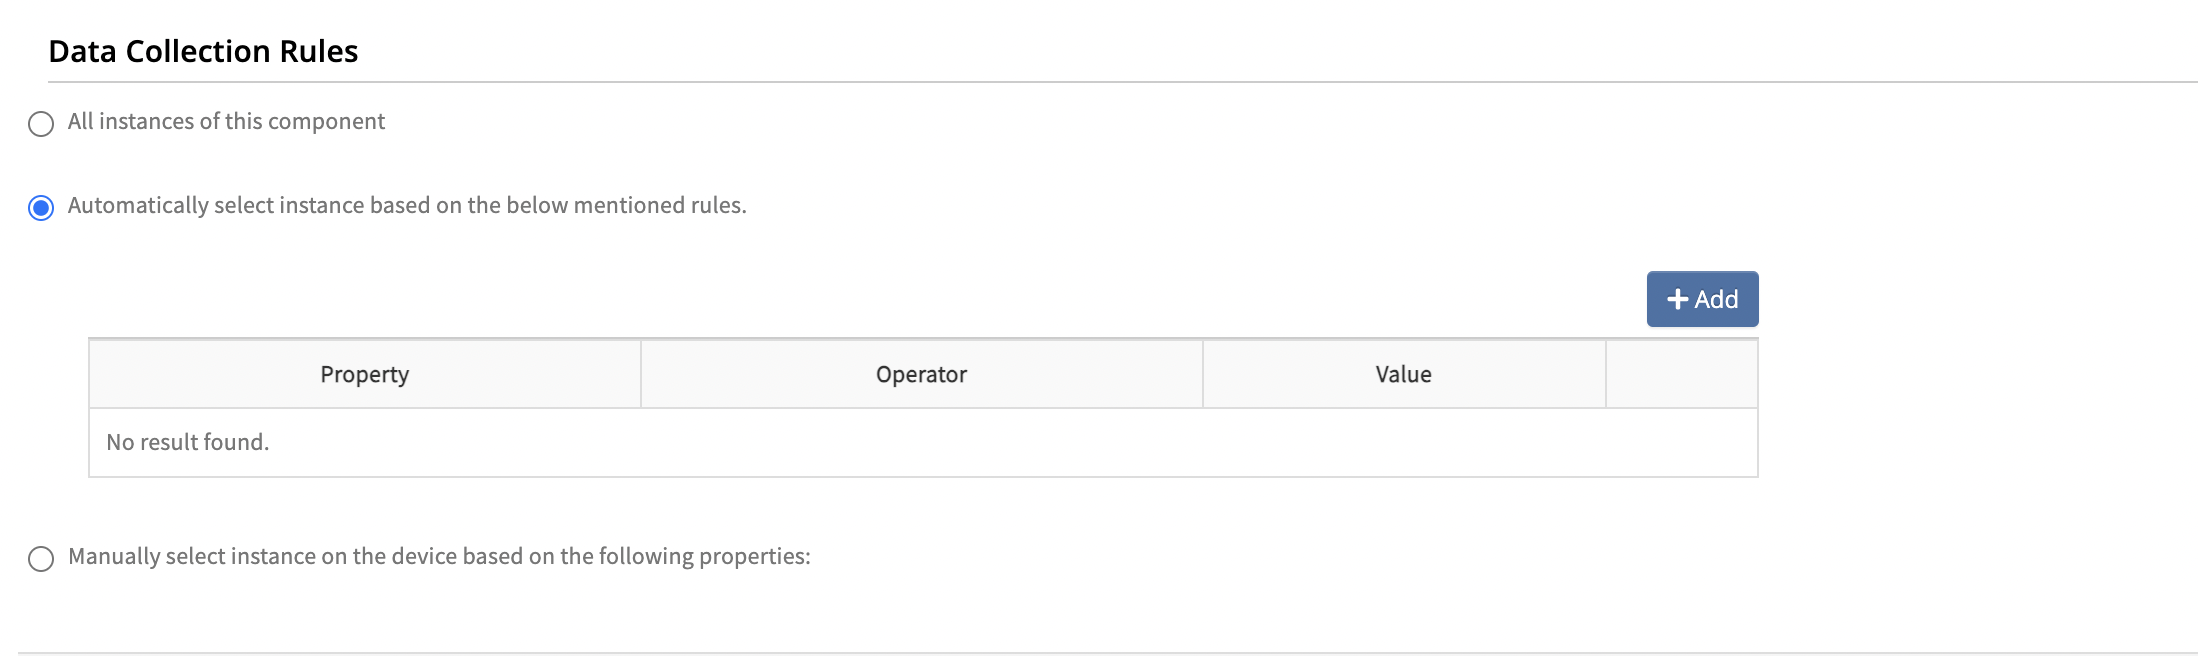
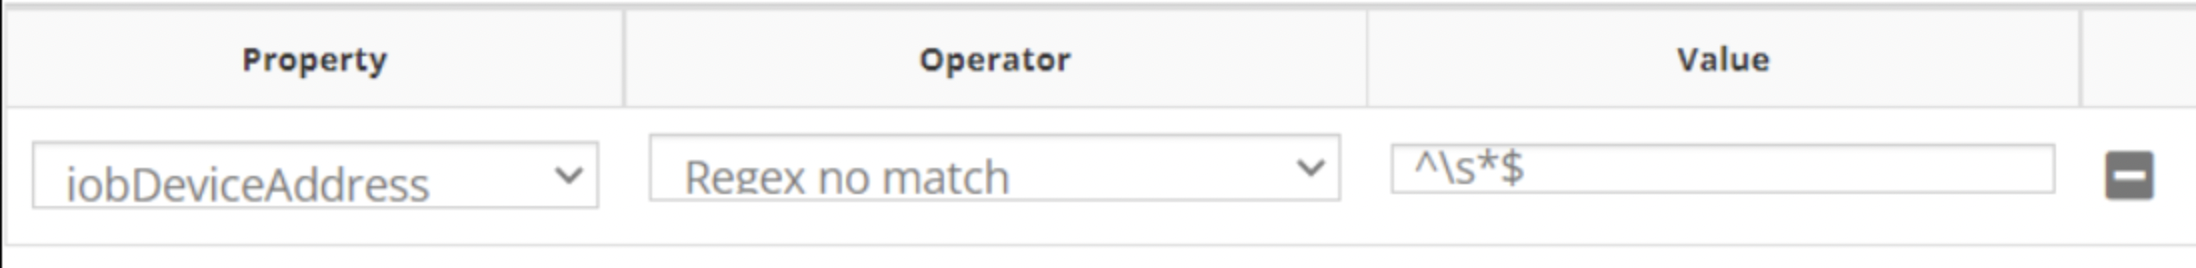
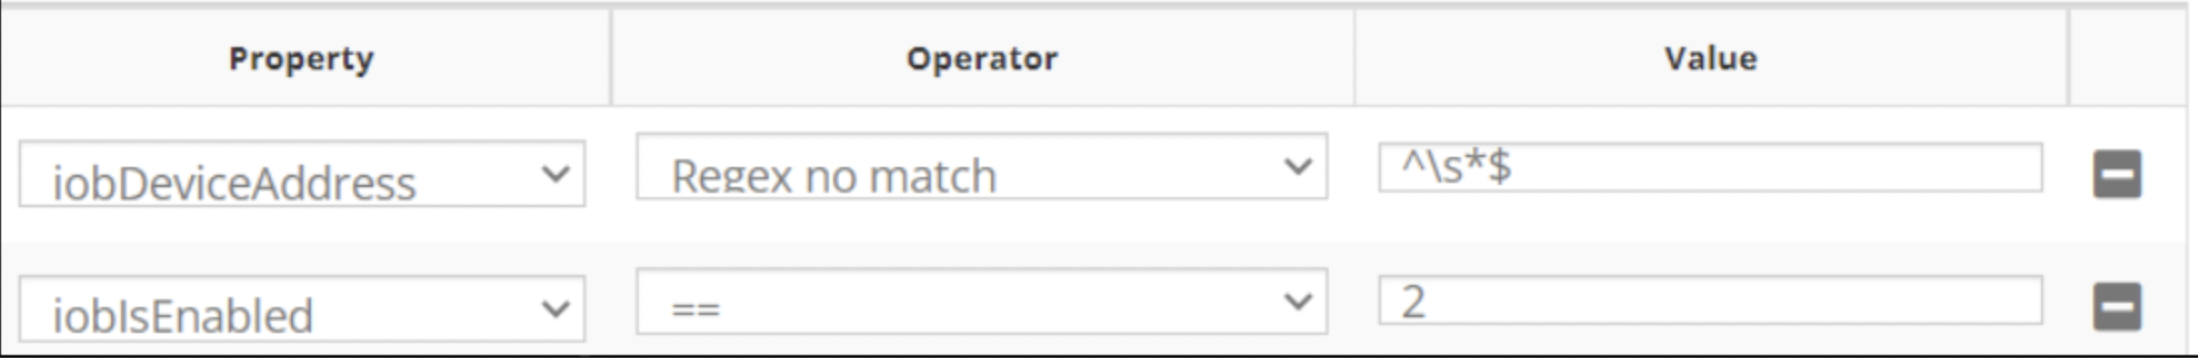
Use Case 12: Excluding Specific Components from Monitoring
Scenario: Exclude components without monitoring value, such as jobs without an IP address.
Solution: Use data collection rules within the monitor to filter and exclude unwanted components.
Refer to Data Collection Rules to exclude specific components for monitoring.
Solution-1
Solution-2
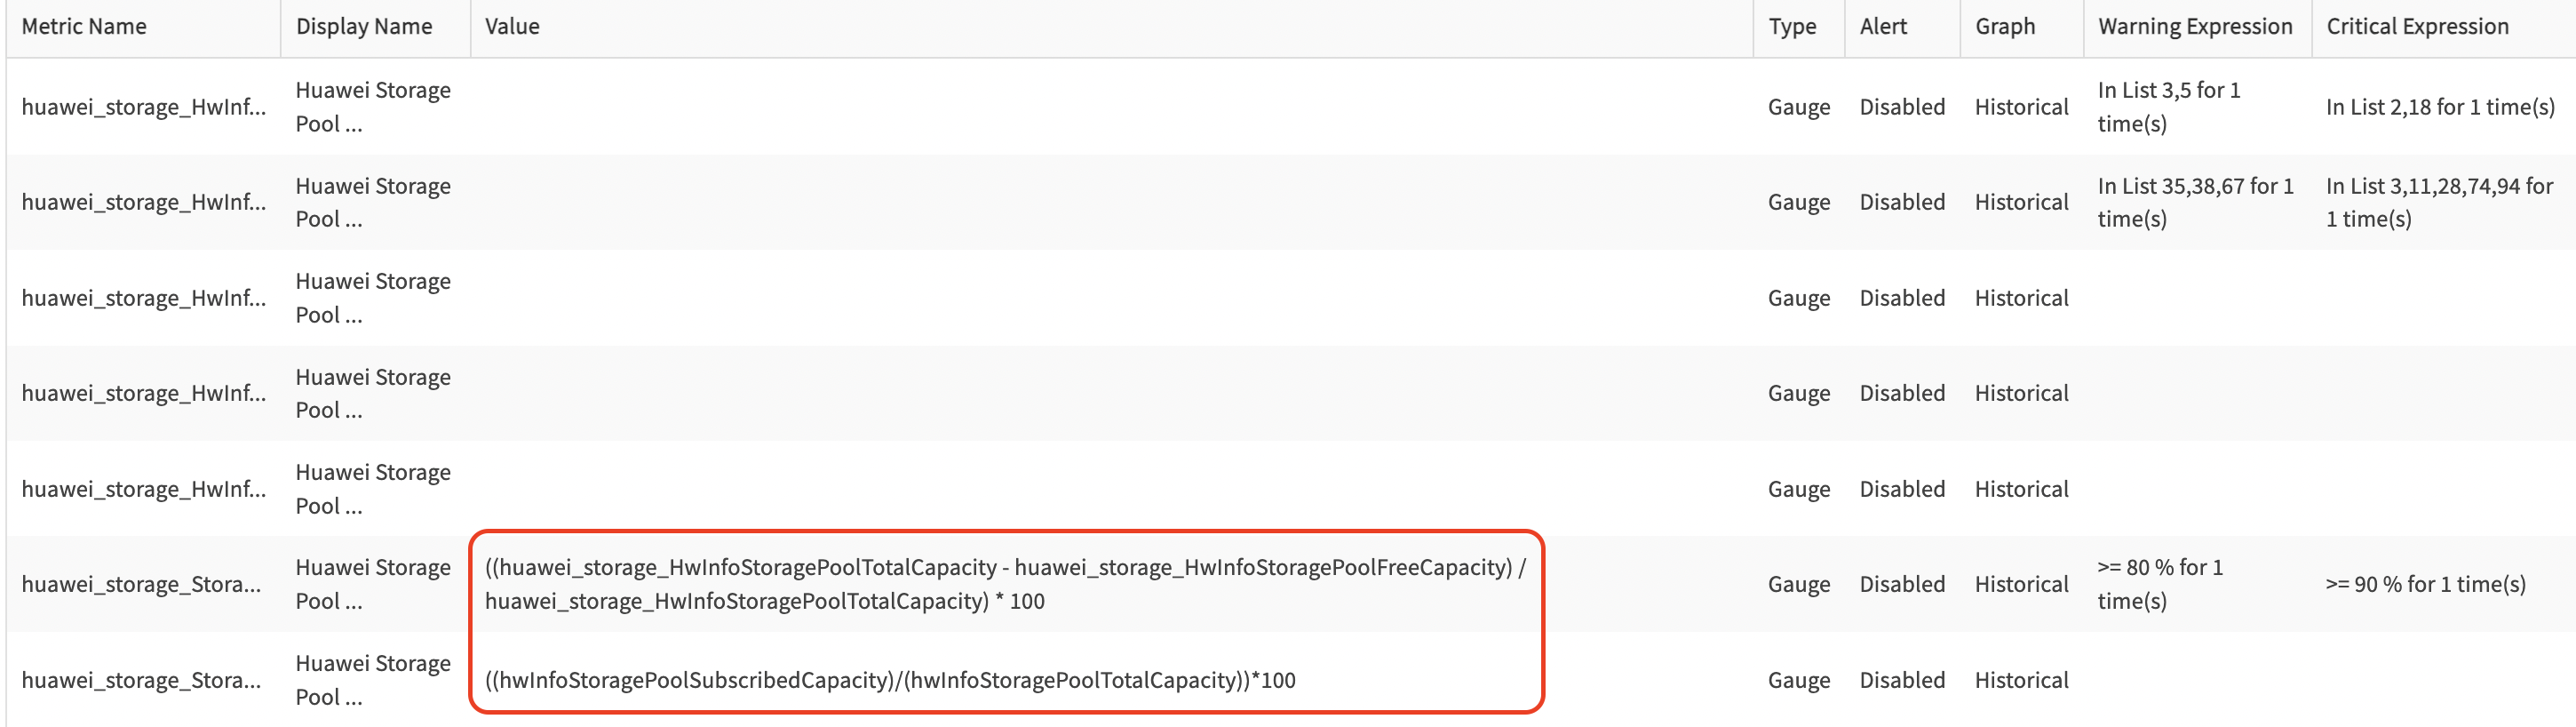
Use Case 13: Verifying Metric Calculations
Solution 1: Export and analyze monitor JSON
The following are the steps:
- Identify the monitor and export its JSON configuration.
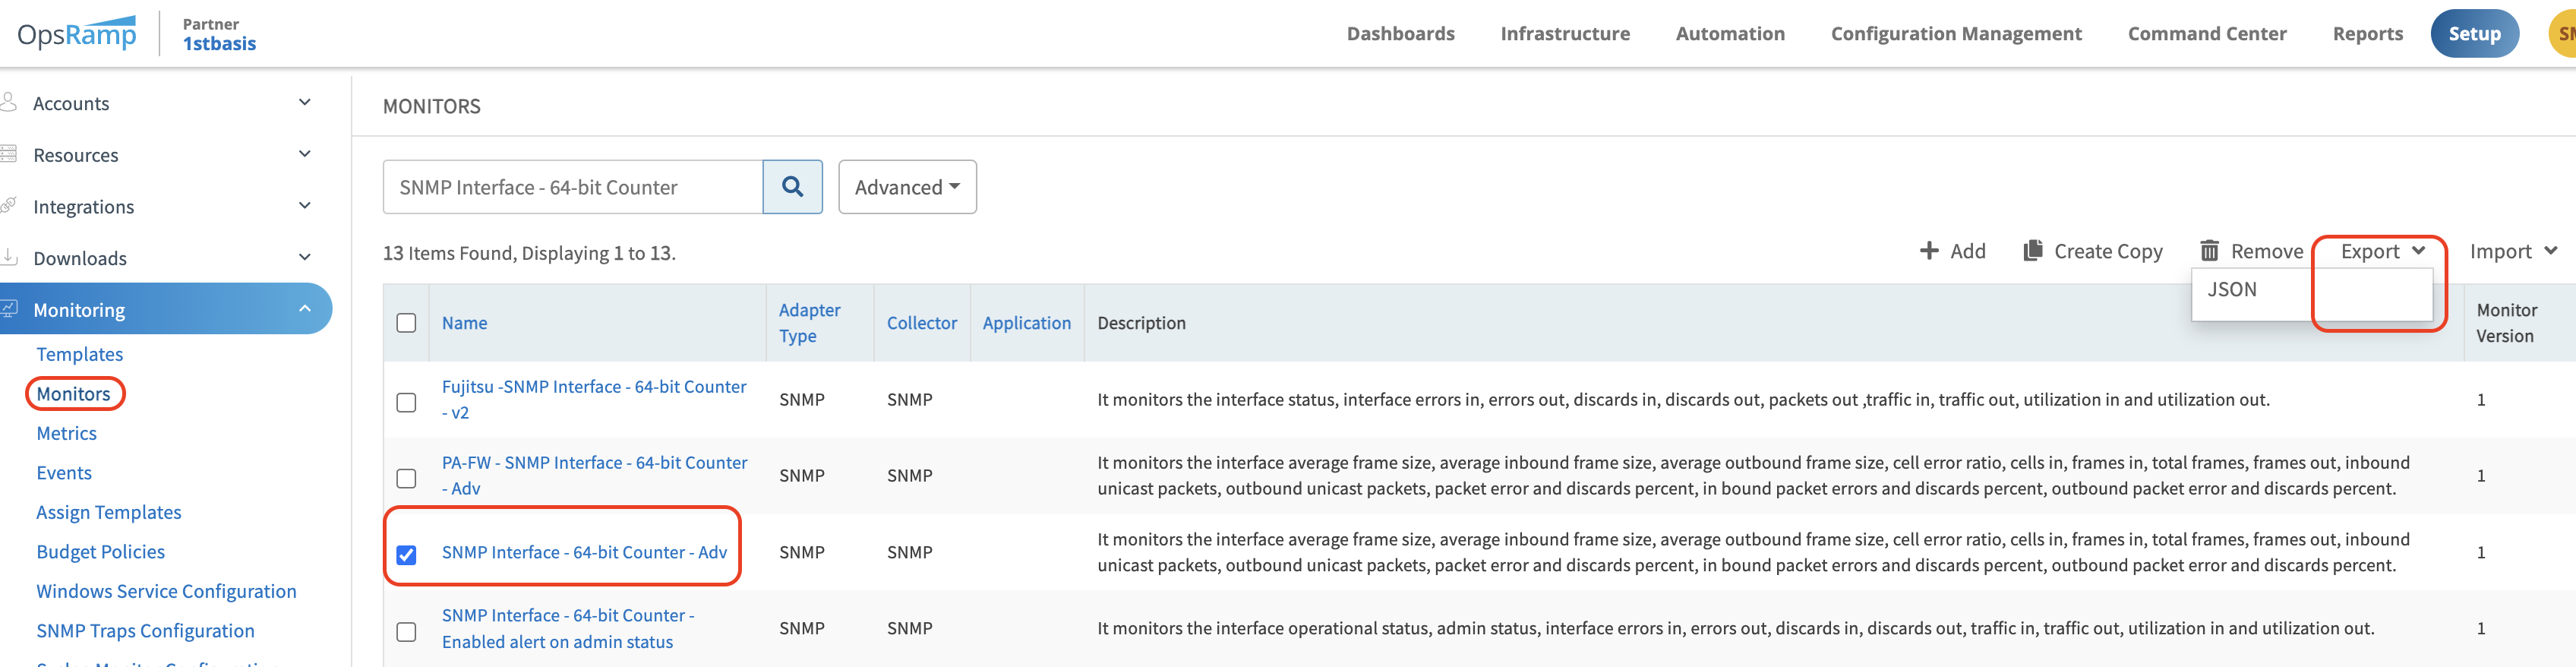
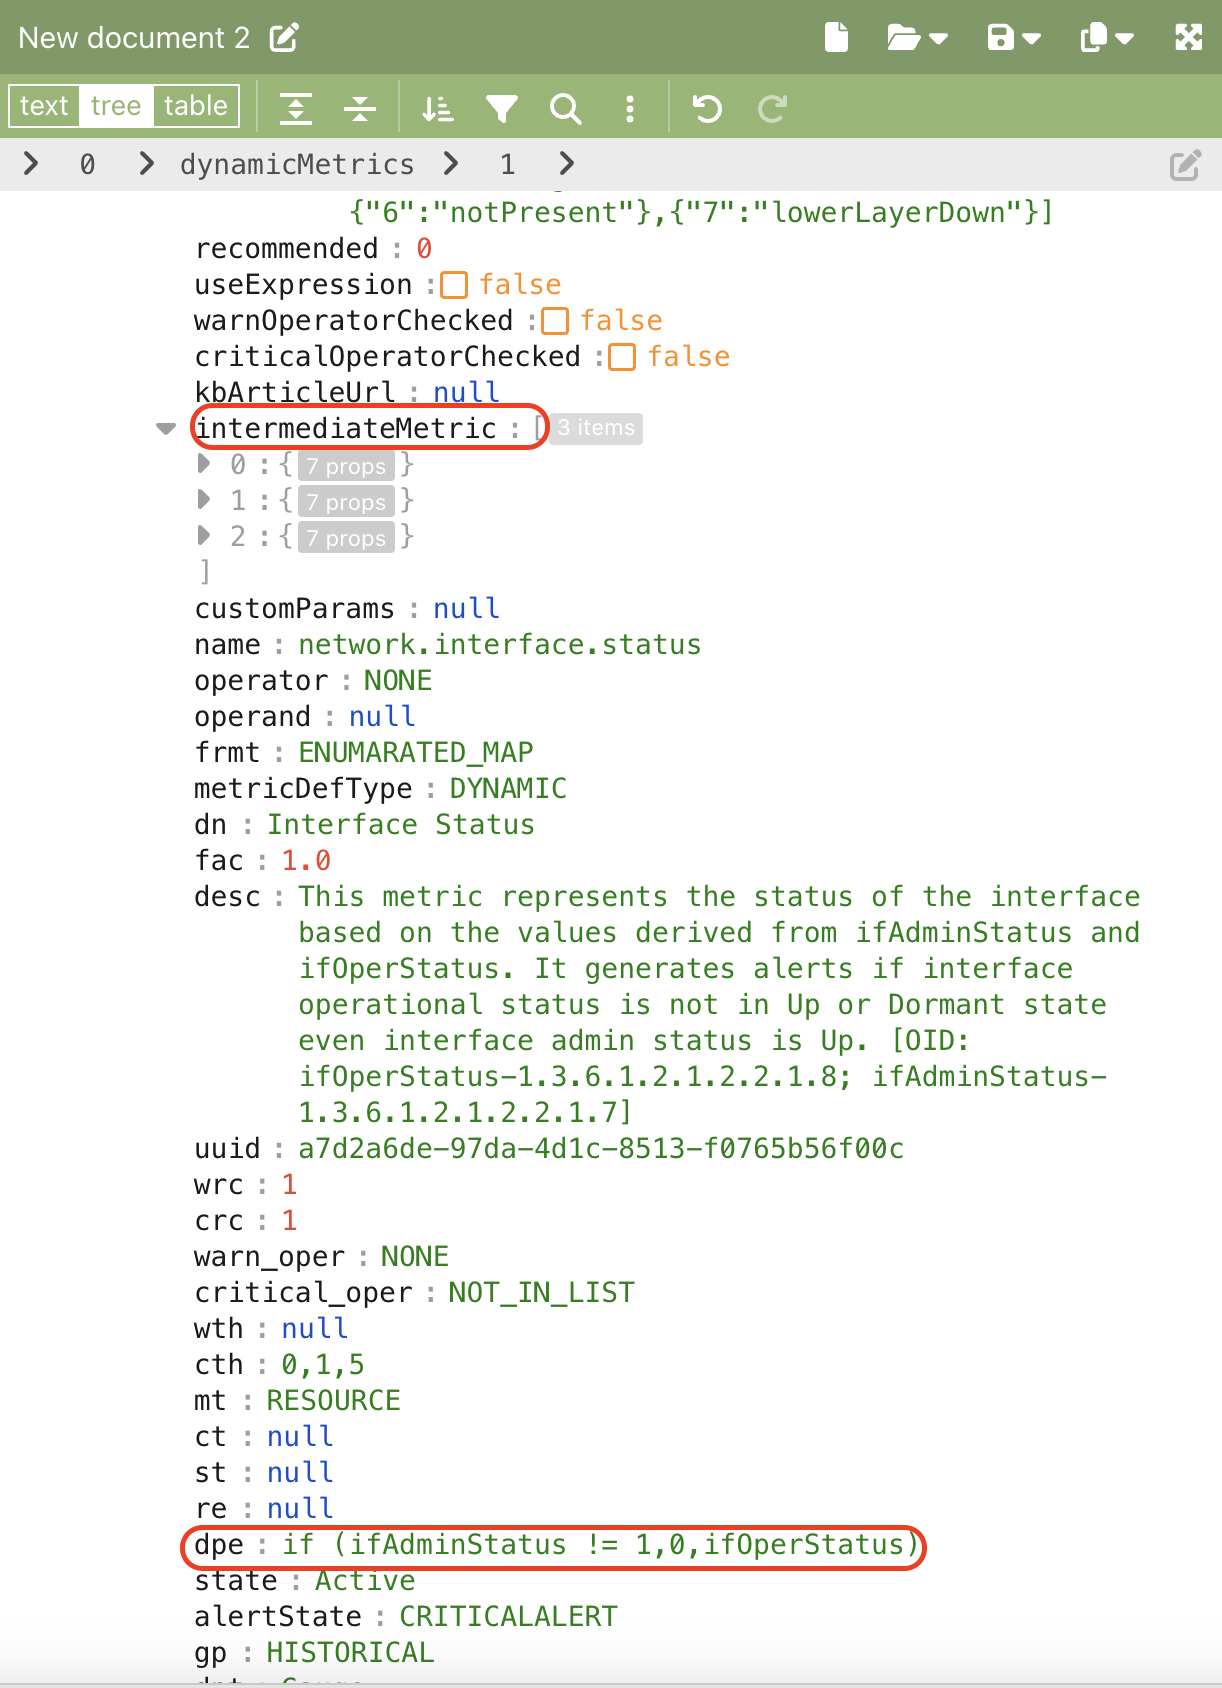
- Open the JSON file and copy the content into an online JSON editor (JSON Editor Online: edit JSON, format JSON, query JSON) to format it. After formatting, expand the JSON and navigate to dynamicMetrics, which contains all metric details.
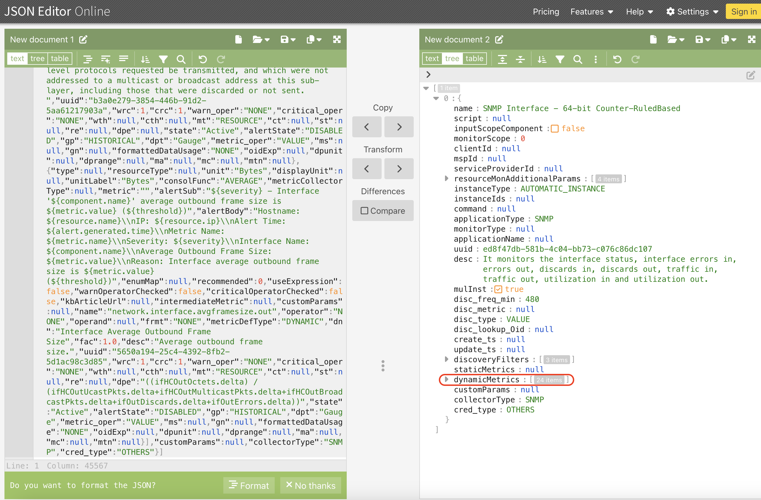
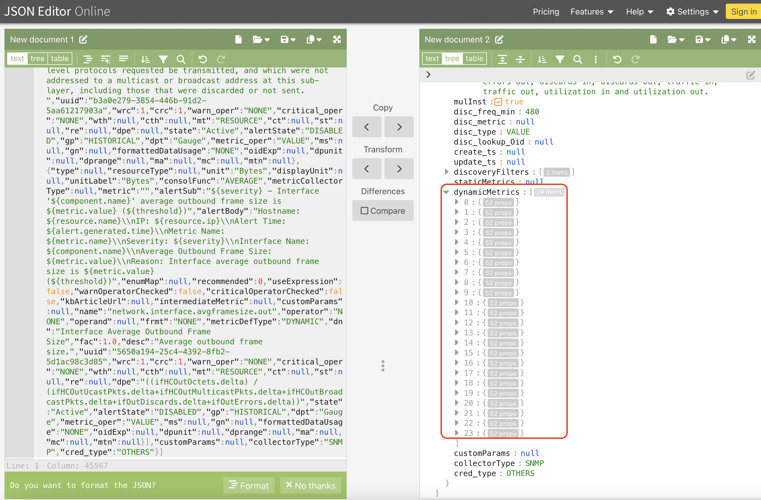
- Expand the dynamicMetrics section. Inside it, locate intermediateMetric, which contains metric details such as name, description, and formulas. Search for “dpe”** to find the formula details.
Solution 2: Create a test copy
Create a monitor copy at the partner level to review calculations directly within the UI. Delete the copy after verification.
Use Case 14: Missed Alerts for 100% CPU Utilization
Alerts are generated based on SNMP responses from the end device. Verify CPU utilization using an SNMP walk when such alerts are expected. Ensure alerting is enabled for the metric and validate the polling frequency and repeat count configuration.
Example: If CPU metric polling frequency is set to 5 minutes with a repeat count of 2, utilization must exceed the configured threshold continuously for 10 minutes (5 × 2) to generate an alert.
Use Case 15: Direct Bulk OK Link Up Alerts from Windows Servers
Direct bulk OK Link Up alerts may be generated from Windows servers during OS reboot or an SNMP service restart on Windows Server 2003 or later. This is a known Windows-related limitation/bug.
Use Case 16: Multiple Devices Not Working with SNMP v3
Steps to troubleshoot:
- Verify whether the credential set was created manually or via API.
- Edit the credential set and update passwords.
- Reapply both the credential set and templates to devices.
- Validate data collection after 5 minutes.
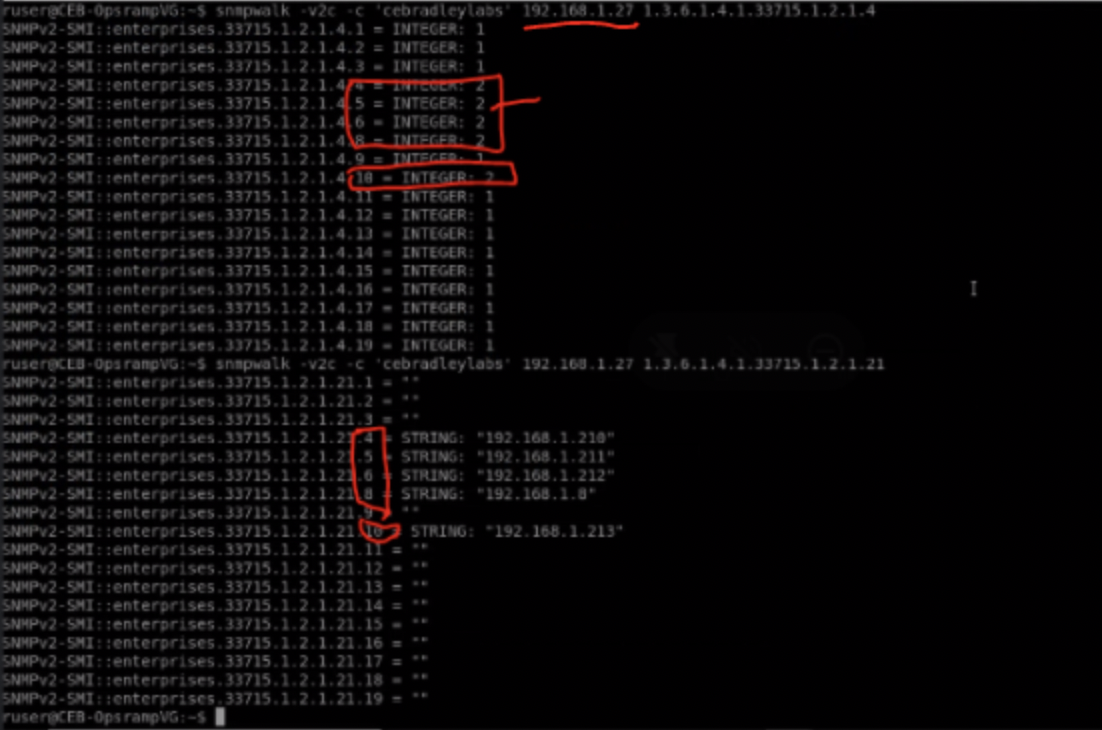
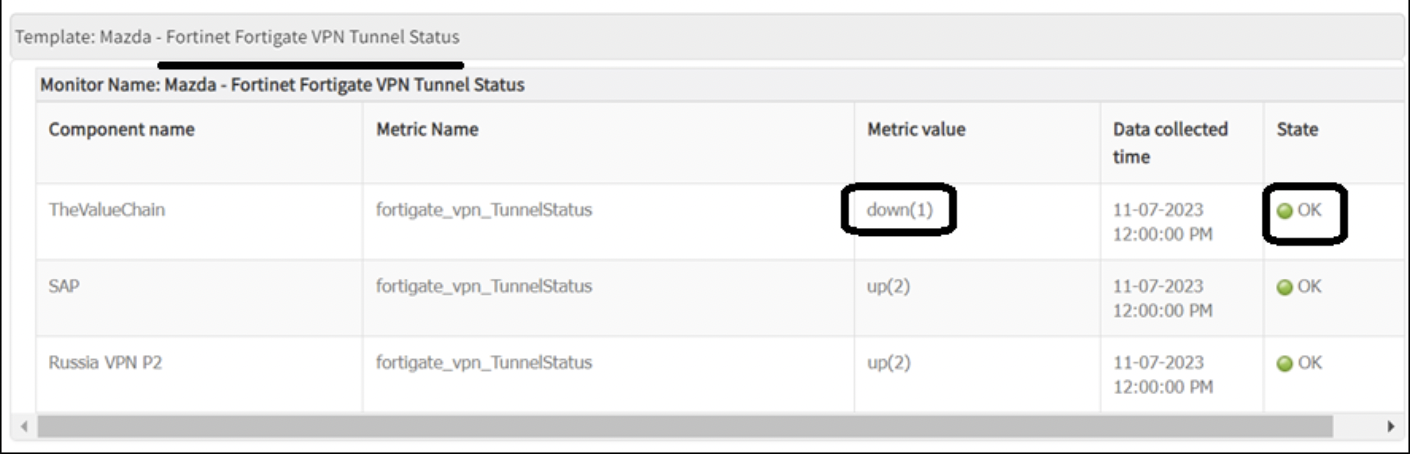
Use Case 17: VPN Tunnel Status Monitor Issue
When applying the VPN Tunnel Status template, the VPN tunnel IP address and name must be provided as input parameters for monitoring.
The provided Remote Peer IP address is compared with the actual remote peer IP address on the end device using SNMP walk.
- If the provided remote peer IP address is found on the device, the tunnel status is shown as Up.
- If the provided remote peer IP address is not found, the tunnel status is shown as Down.
Use Case 18: Difference Between Metrics and Metrics (Beta) Tabs
Metrics: Graph widgets display based on metric group names. When both Agent and SNMP templates apply to the same device, related metrics appear in the same widget.
Metrics (Beta): Graph widgets display individual metric names in separate widgets, providing better visibility. This tab is recommended for improved metric graph clarity.
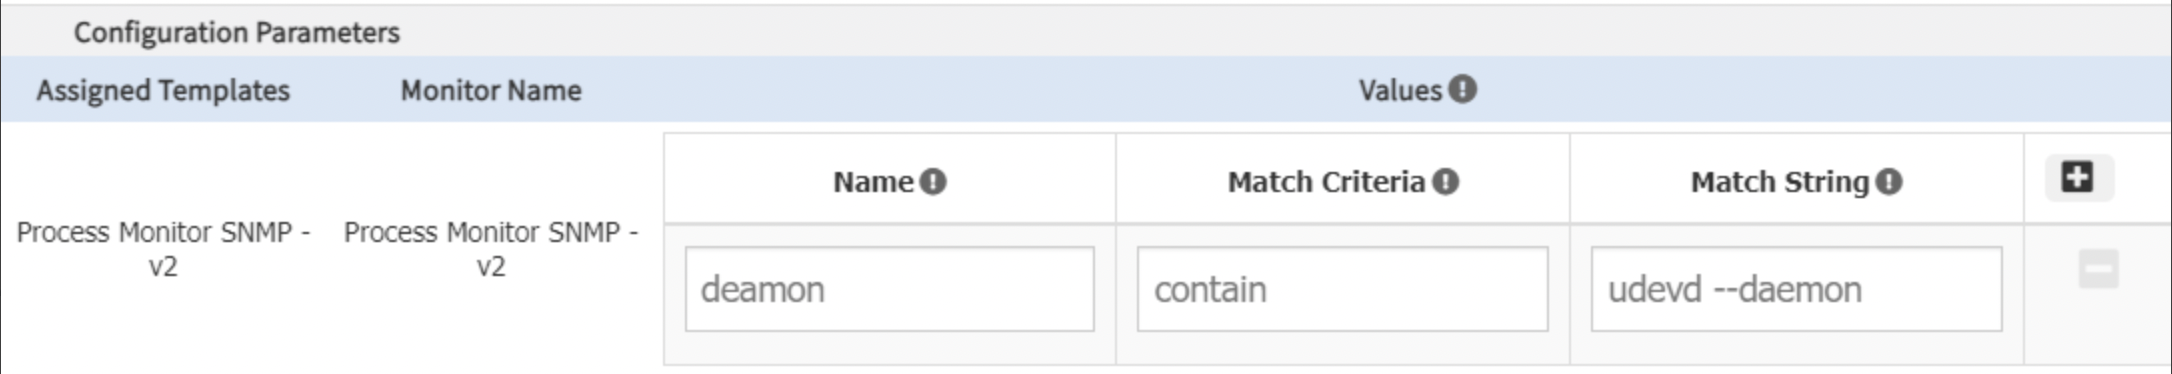
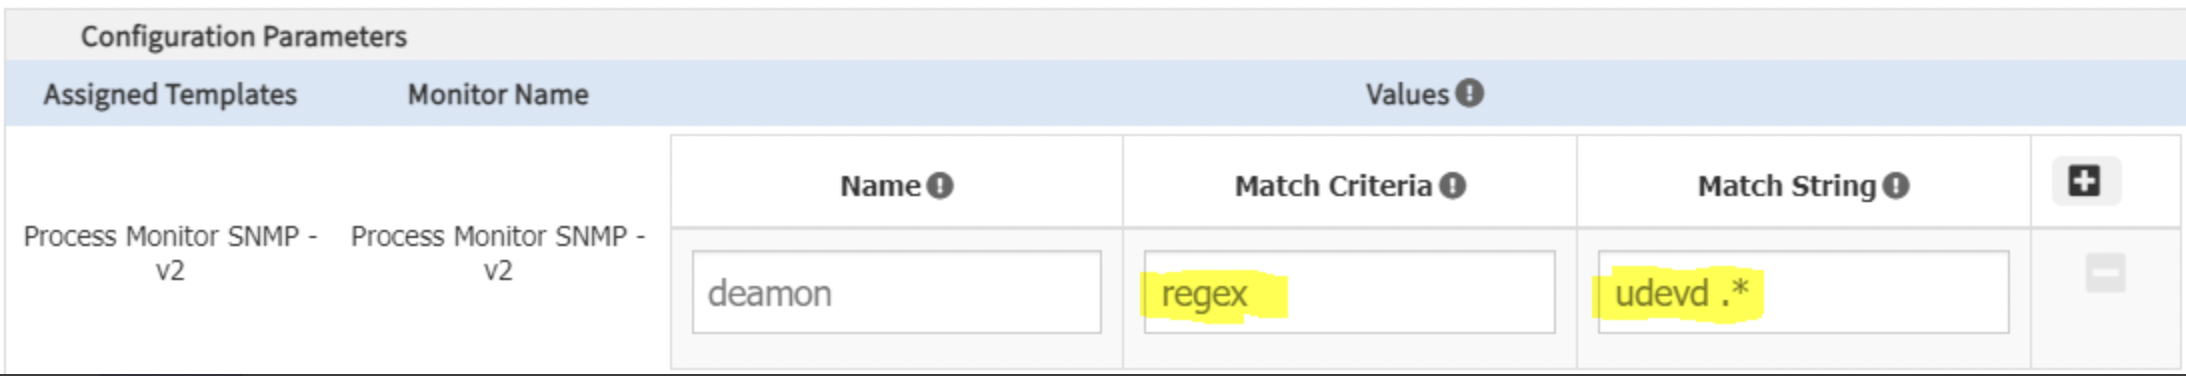
Use Case 19: Process Monitoring Not Working (SNMP)
Template: Process Monitor SNMP - v2 (input-based template)
Steps:
- Perform SNMP walk for
hrSWRunName(1.3.6.1.2.1.25.4.2.1.2)
Example:
HOST-RESOURCES-MIB::hrSWRunName.7371 = STRING: "udevd"
- Perform SNMP walk for
hrSWRunParameters(1.3.6.1.2.1.25.4.2.1.5)
Example:
HOST-RESOURCES-MIB::hrSWRunParameters.7371 = STRING: "--daemon"
- Combine values with whitespace:
hrSWRunName <WHITESPACE> hrSWRunParameters
Syntax:
hrSWRunName <WHITESPACE> hrSWRunParameters
Example:
udevd --daemon
- Configure fields:
- Name: Friendly name (any value can be provided).
- Match Criteria: regex / contain / exact
- Match String: Combined value from Step 3
Example
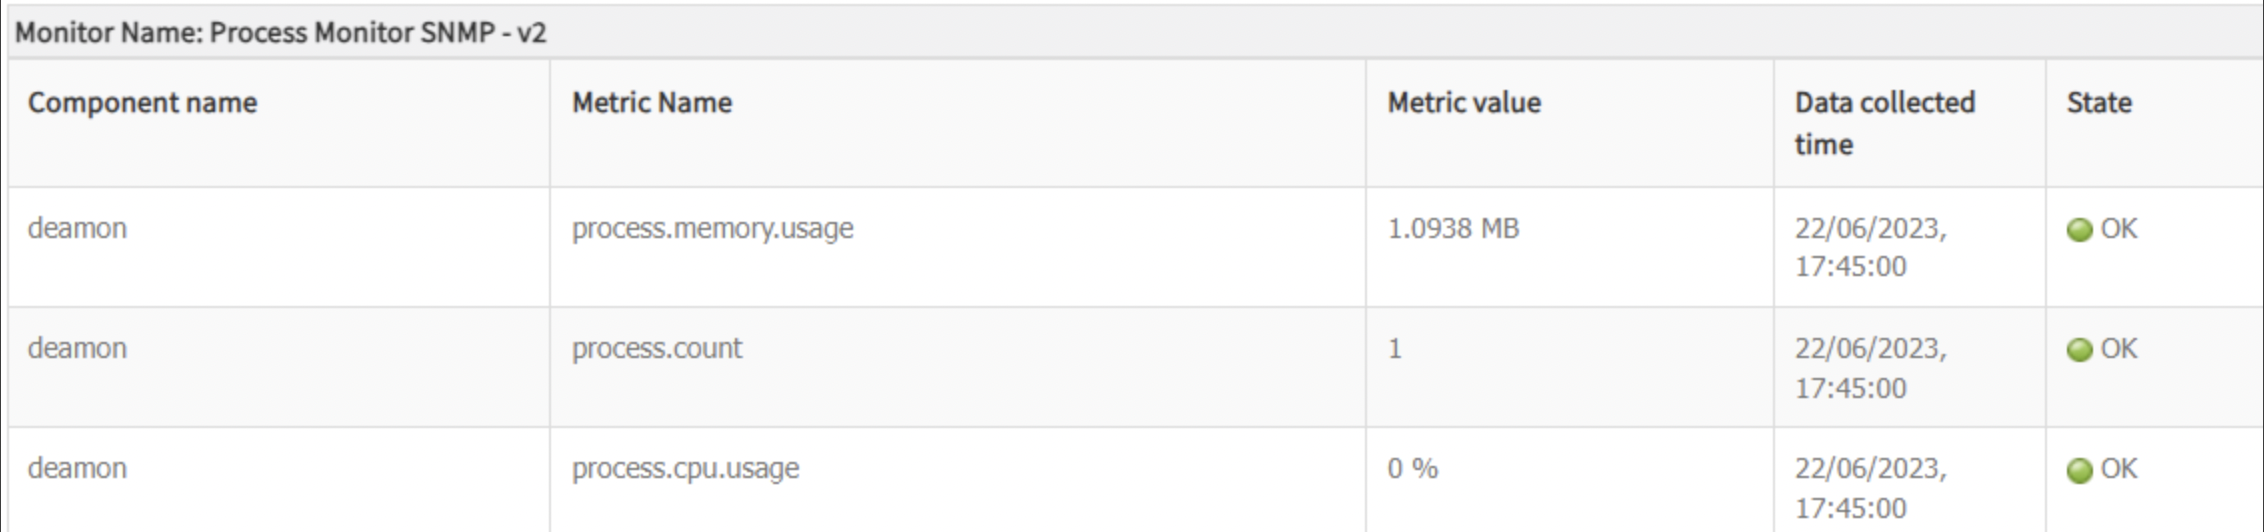
Use Case 20: Metric Shows “OK” When Component Is Down
If the metric component is down but the state appears as “OK” when using Get Latest Metrics, it is due to alerting configuration.
As per design, when alerting is disabled, threshold comparison does not occur. As a result, the monitoring system cannot determine whether the state is Critical or OK, and by default assigns an OK severity.To resolve this, enable alerting for the metric.
Use Case 21: Alert Missed on Metric
If a template has 5-minute poll frequency and repeat count of 3, the metric must exceed the threshold for three consecutive polls (5 × 3 = 15 minutes) to generate an alert.
If values return to normal before 15 minutes, no alert is generated.
Use Case 22: False Uptime Alerts Being Generated
The issue is related to the SNMP uptime metric. The system.uptime metric uses a 32-bit counter OID (1.3.6.1.2.1.1.3), which can store values up to 2³². This allows uptime to be tracked for a maximum of 497 days (4294967296 hundredths of seconds).
Once this limit is reached, the counter resets to 0 and starts counting again, which can result in false uptime alerts.
An alternative OID (1.3.6.1.6.3.10.2.1.3.0) supports uptime tracking for up to 135 years without resetting.Recommended Template: SNMP Engine Uptime
Use Case 23: SNMP Timeout Alerts
Initial checks: Perform SNMP walk manually and capture traffic using tcpdump.
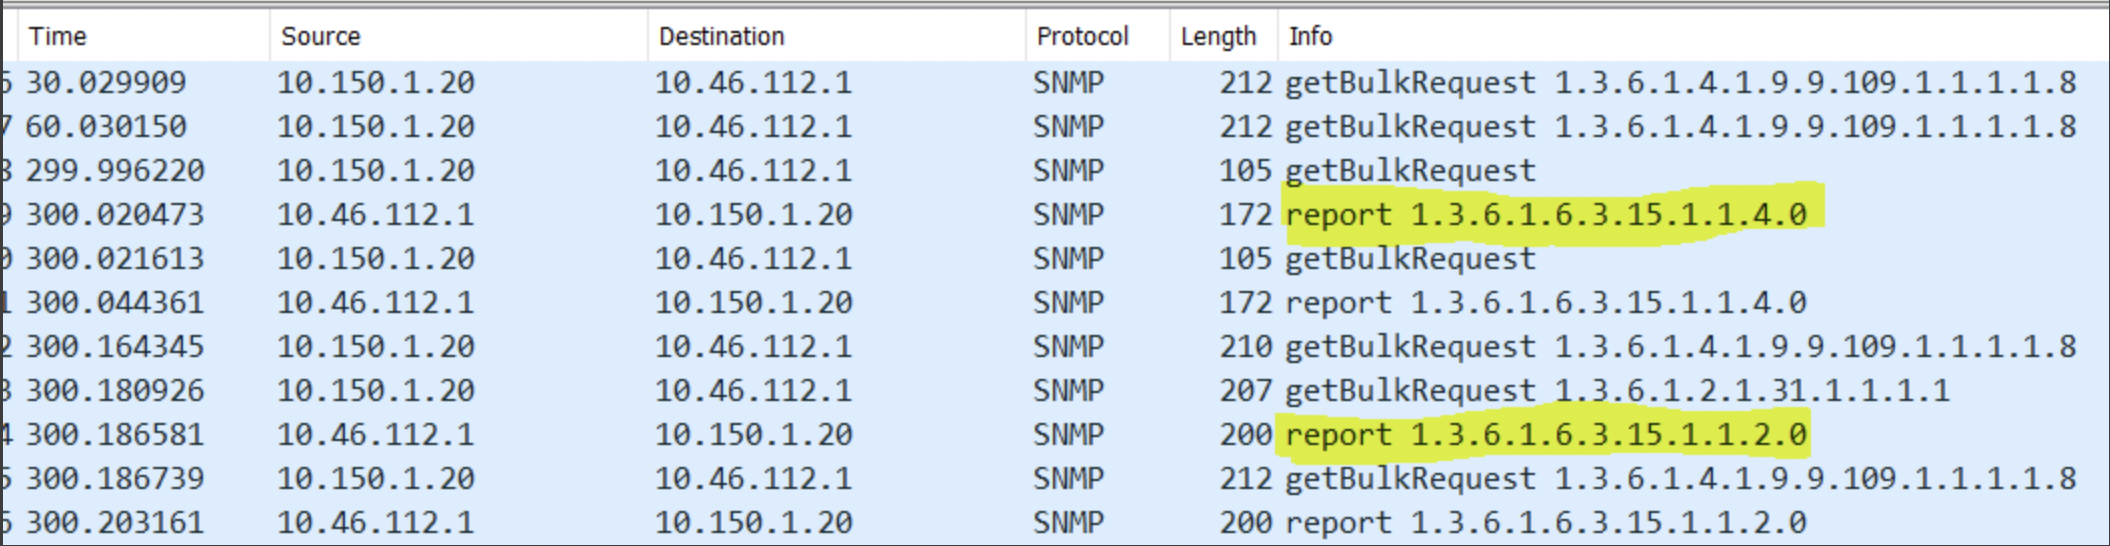
In some cases, instead of valid OID response values, error messages are returned from the end device.
Common SNMP v3 errors:
- 1.3.6.1.6.3.15.1.1.2.0 – usmStatsNotInTimeWindows Description: The total number of packets received by the SNMP engine which were dropped because they appeared outside of the authoritative SNMP engine’s window.
- 1.3.6.1.6.3.15.1.1.4.0 – usmStatsUnknownEngineIDs Description: The total number of packets received by the SNMP engine which were dropped because they referenced an snmpEngineID that was not known to the SNMP engine.
Analysis: This is an SNMP v3-related issue, where SNMP response packets are being dropped due to the above exceptions.
Resolution:
- Fix the SNMP v3 agent configuration on the end device.
- As a workaround, creating a new SNMP v3 user may help resolve the issue.
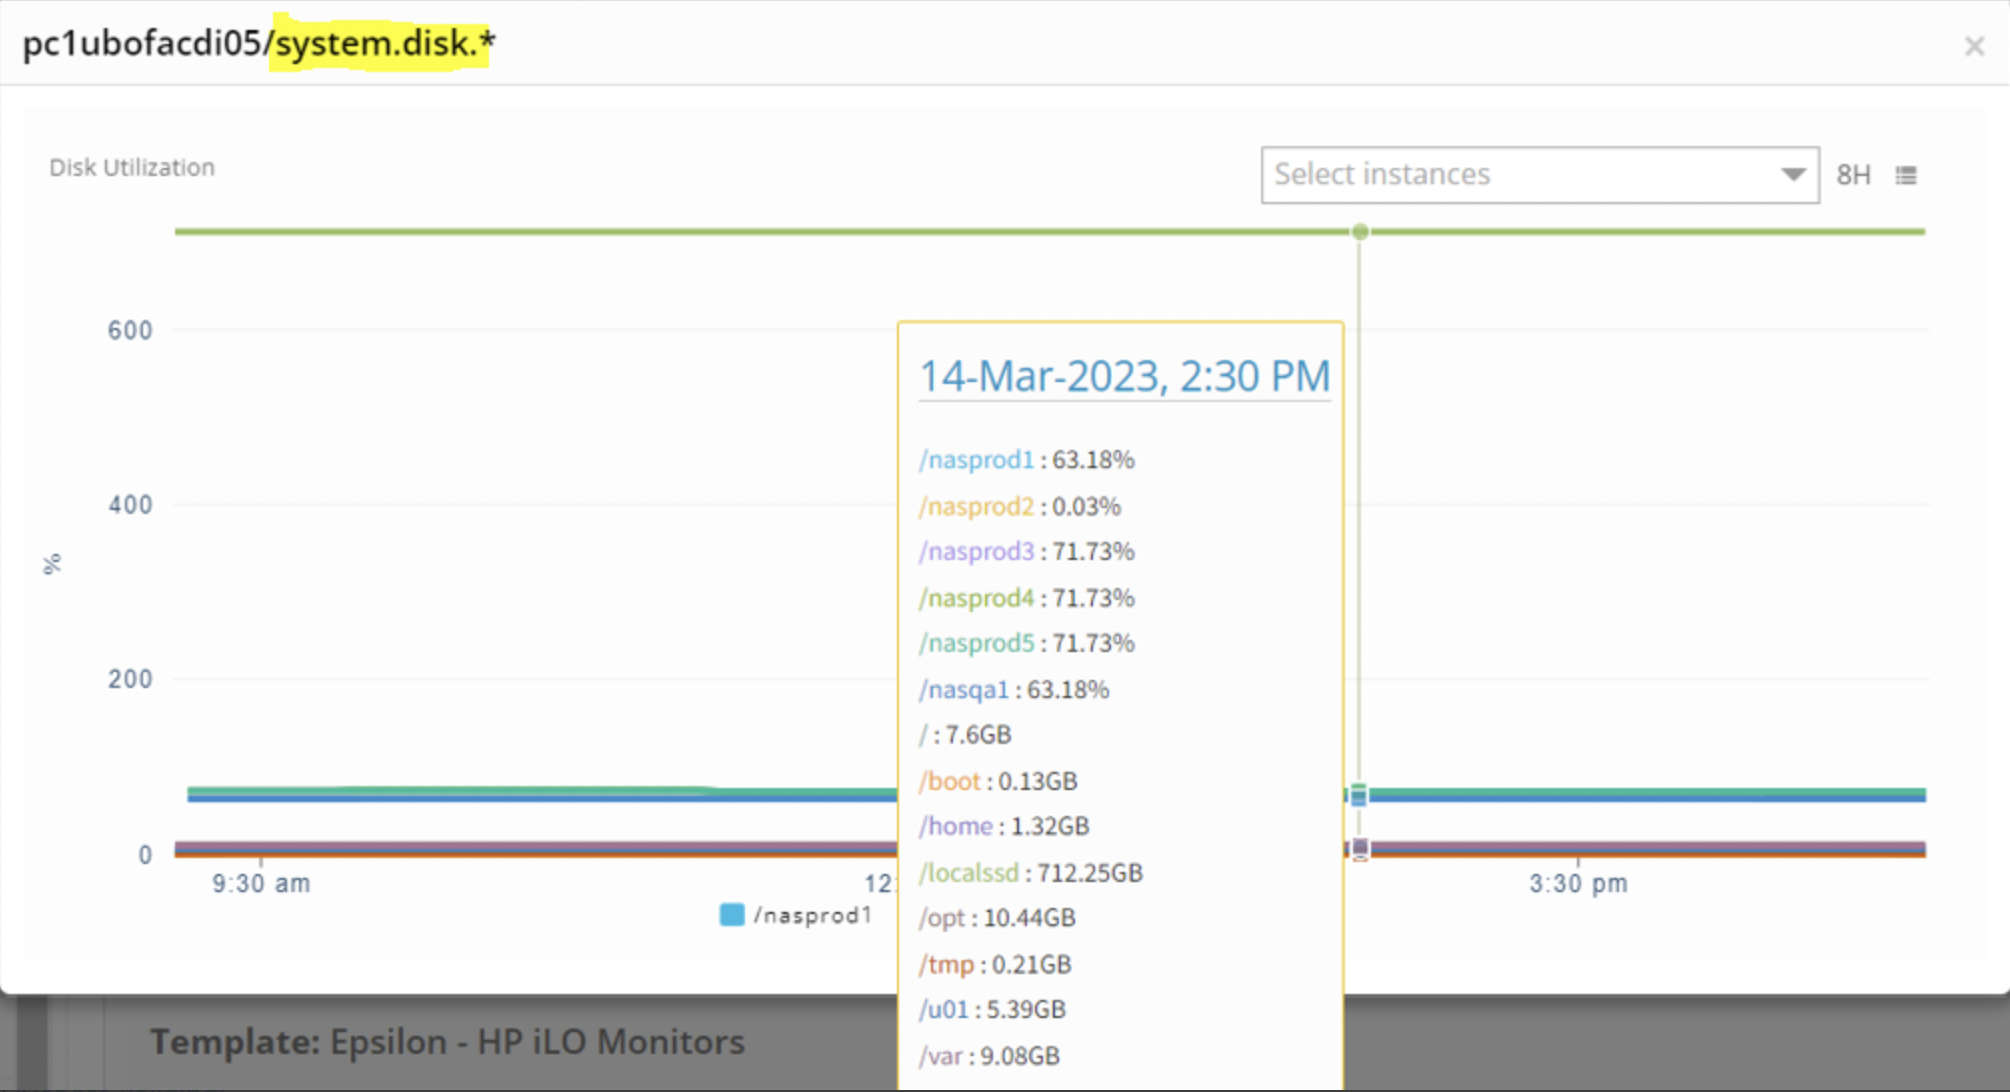
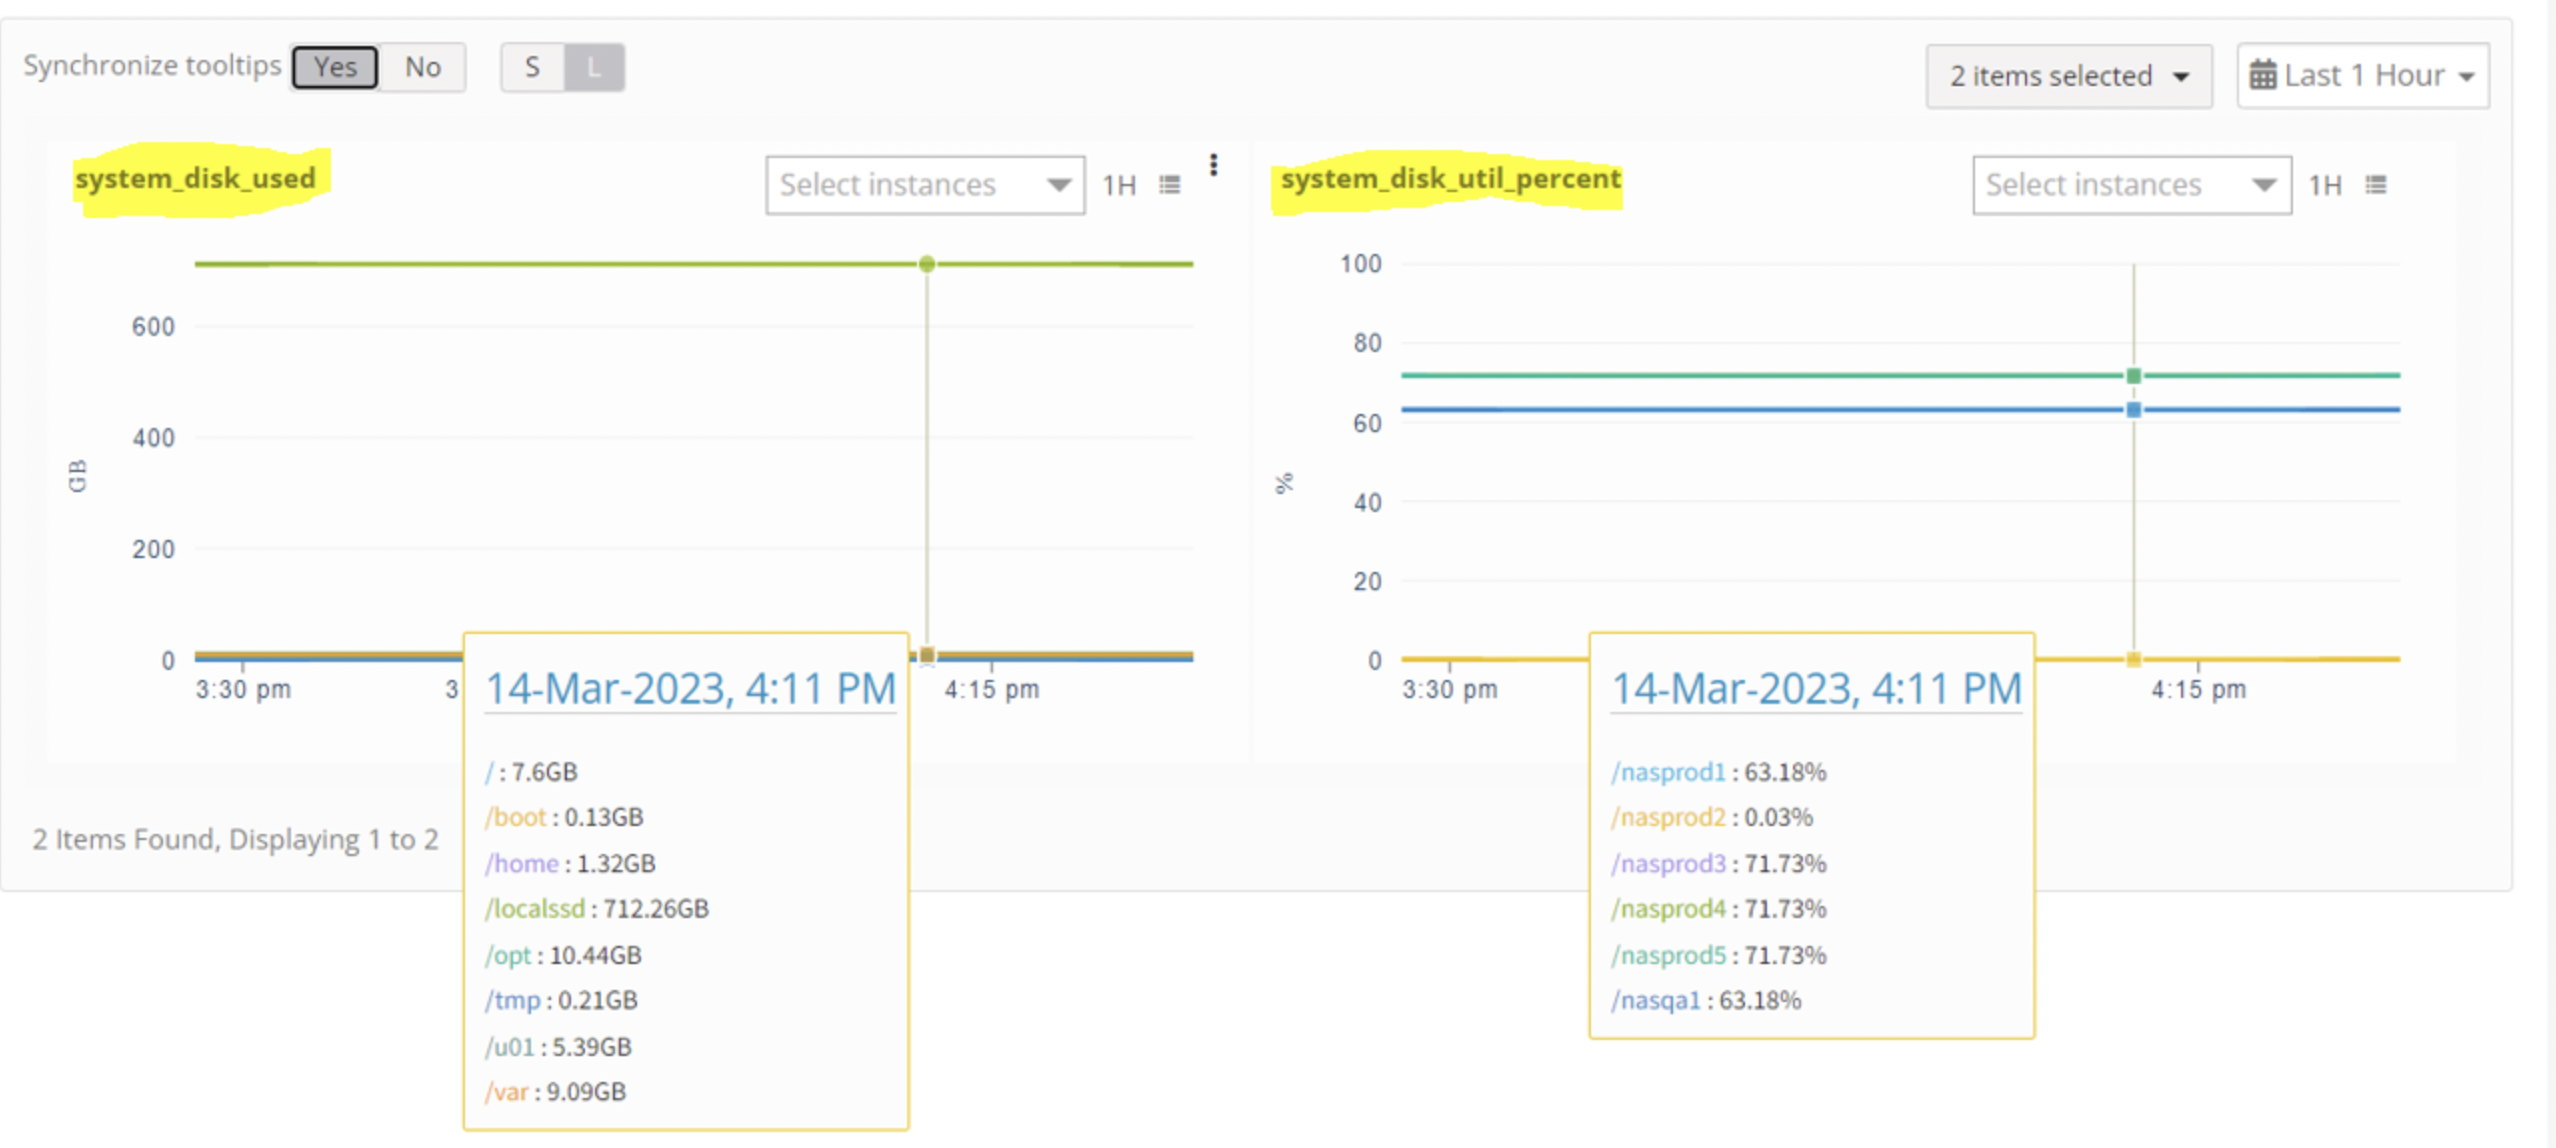
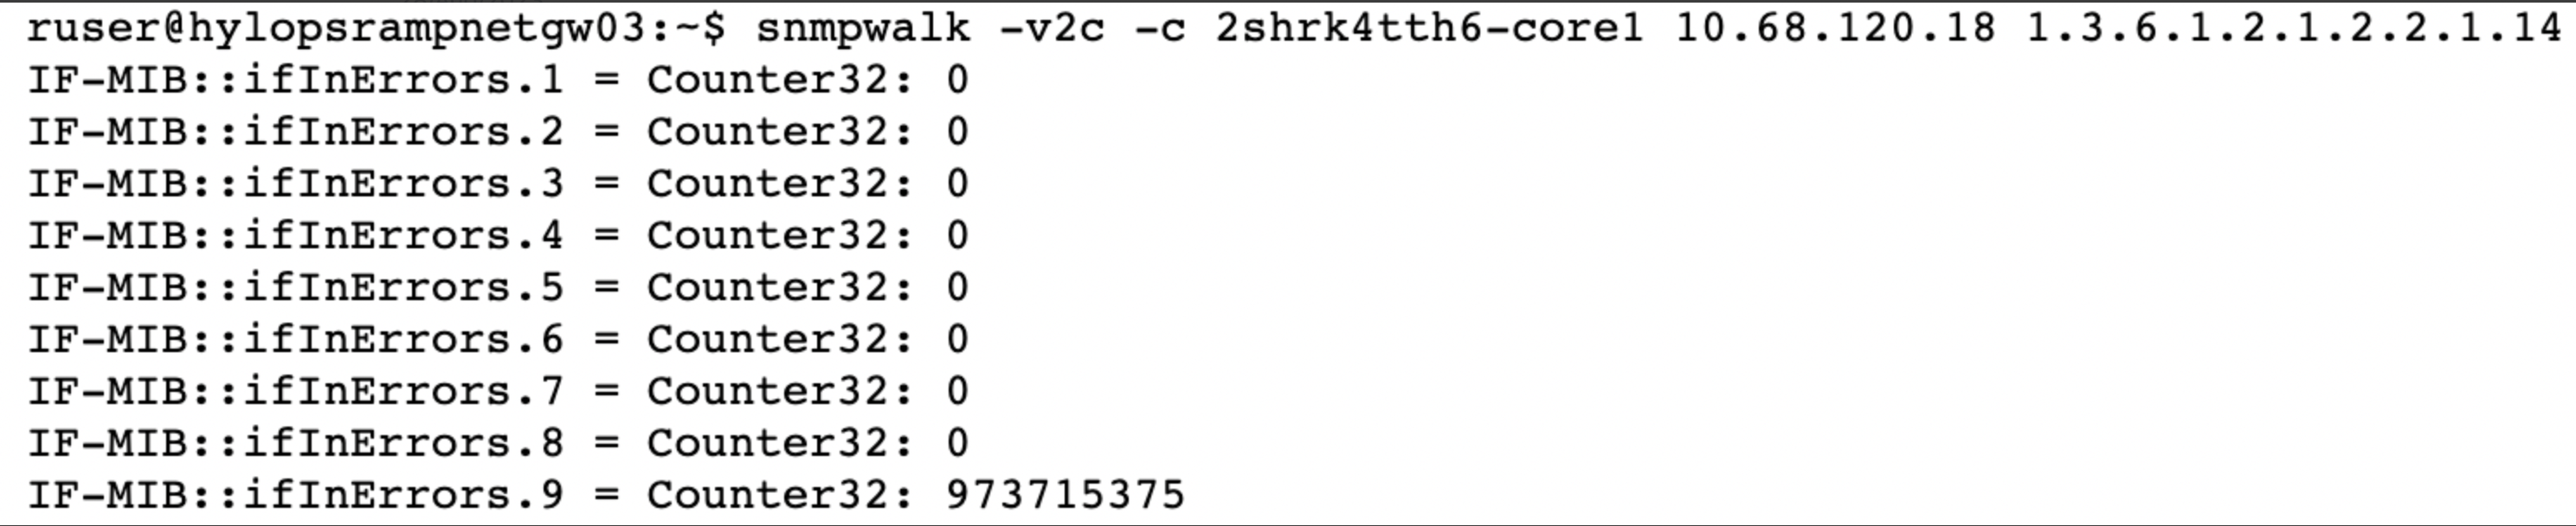
Use Case 24: SNMP Data Not in Sync with Template (ifInErrors)
SNMP Data on the Device:
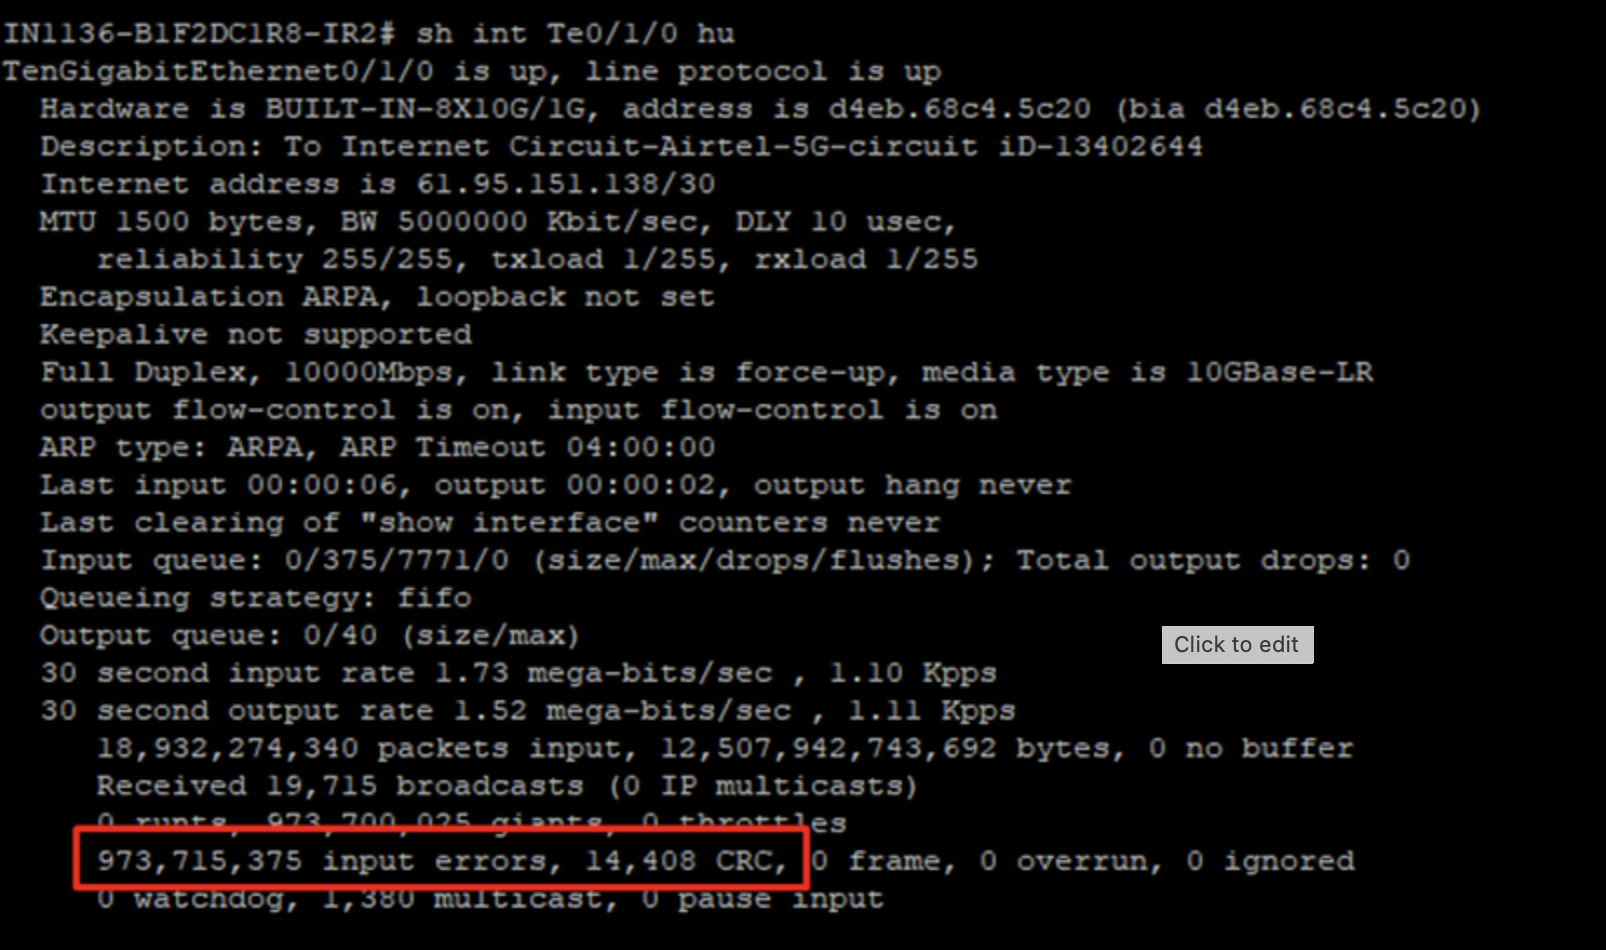
Metric Data in OpsRamp:
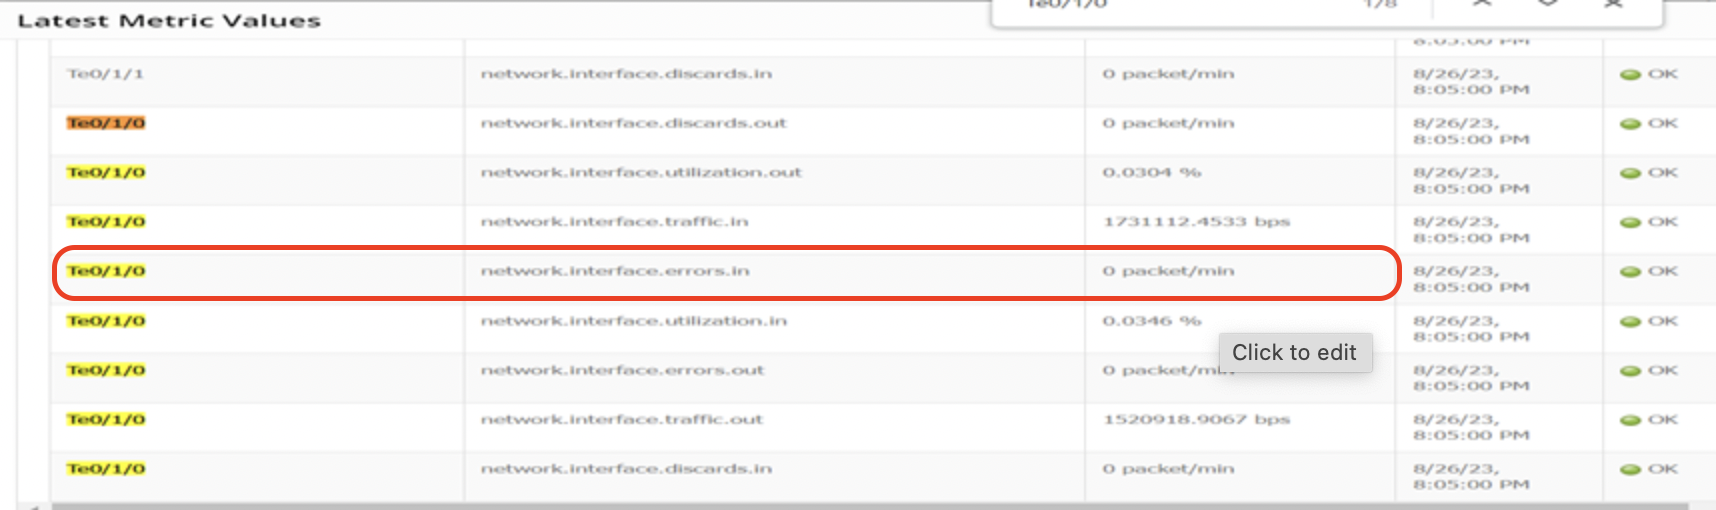
Initial Checks:
- Review the metric configuration to verify whether the calculation is based on rate, delta, or another method.
- If it is a global monitor, create a copy of the monitor and edit it to view metric details.
- Navigate to the metric and review its configuration.
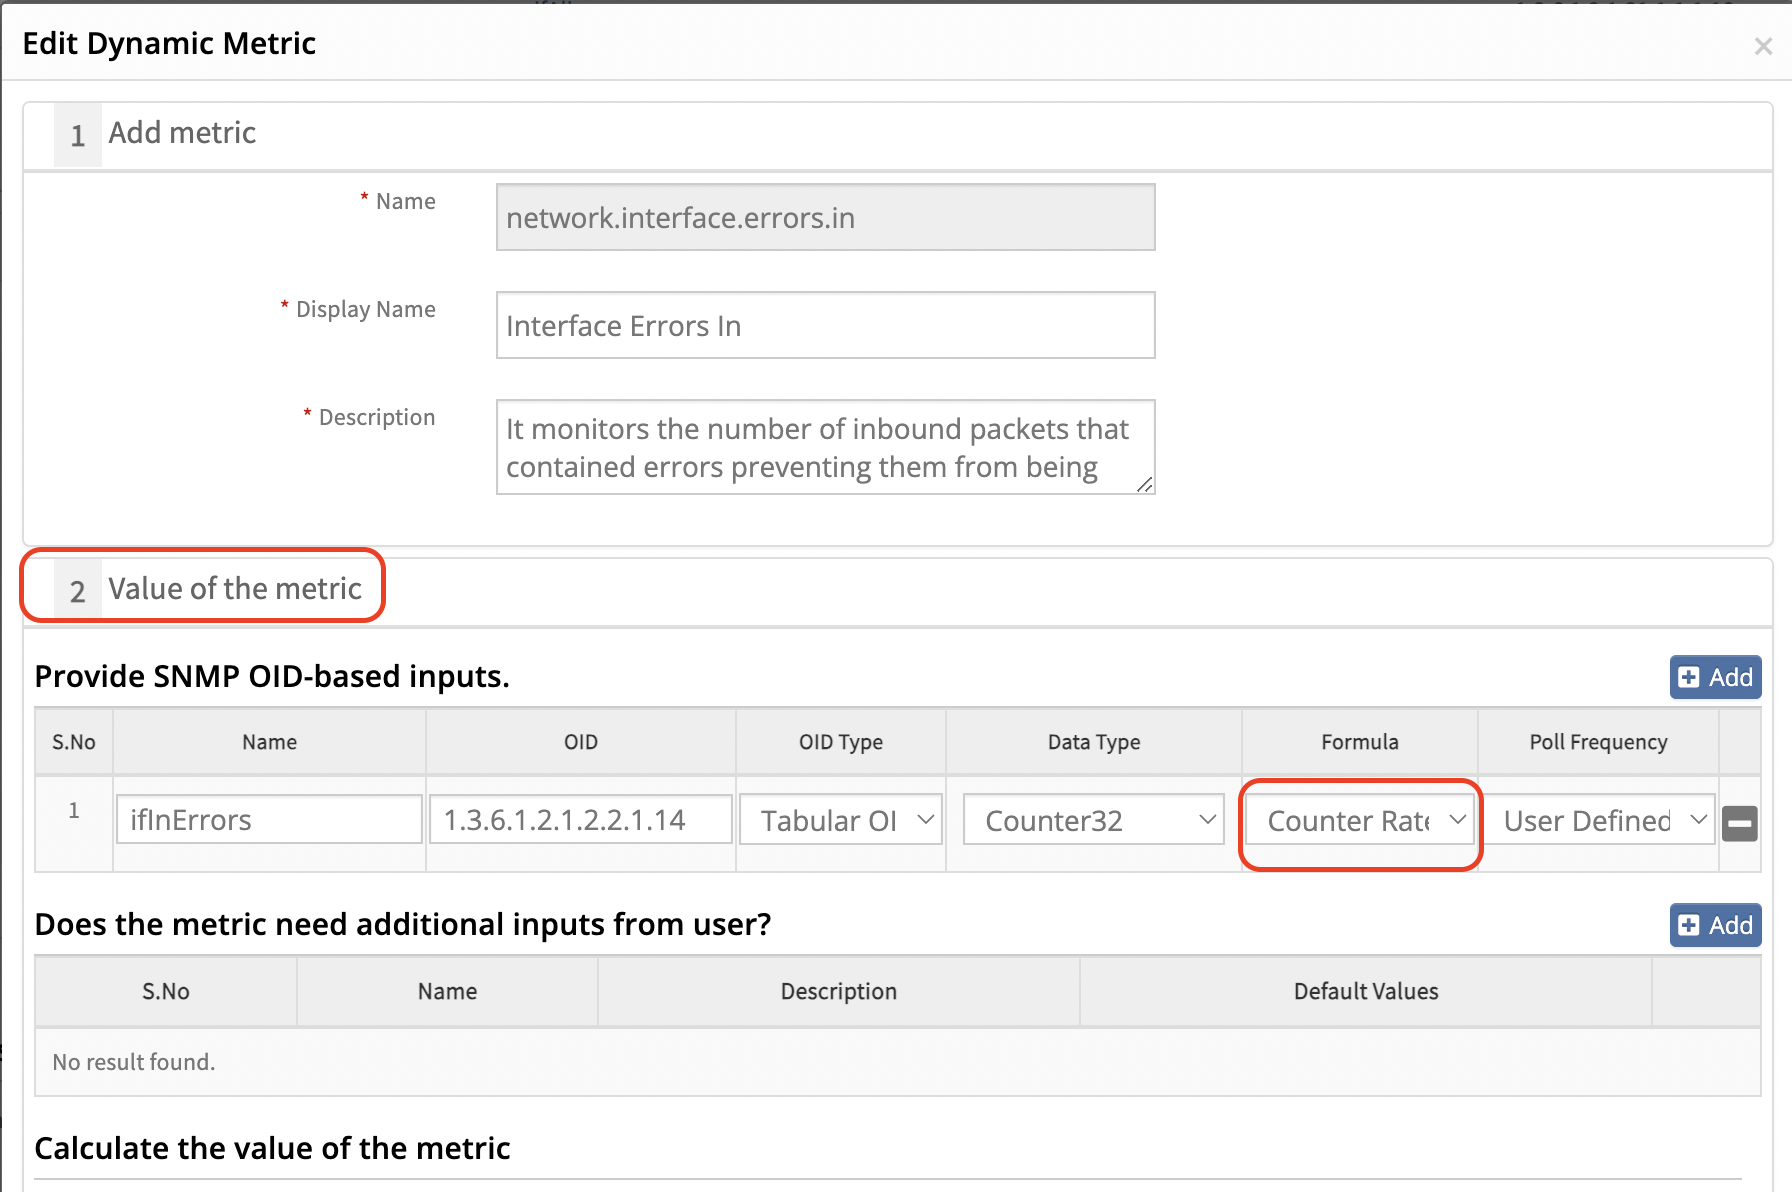
As per the metric network.interface.errors.in, the value represents the rate of input errors on a network interface over a period of time.
Formula Used:
Rate(ifInErrors) = (current ifInErrors - previous ifInErrors) / (current time - previous time)
Where:
- Rate: Change in value per unit time
- current ifInErrors: Current input error count
- previous ifInErrors: Previous input error count
- current time: Current timestamp
- previous time: Previous timestamp
Analysis:
If the error count remains unchanged between consecutive polling intervals, the calculated rate will be 0, even though the total counter value exists on the device.
Recommendation:
- Monitor the error count over a period of time to check for any increase.
- Share the SNMP walk of the device to validate whether the counter value is changing.
Example

Use Case 25: Gaps Observed in Metric Graphs
Check for SNMP timeout alerts on the device. Increase the connection timeout in the credential set to avoid data gaps.
Use Case 26: Alerts Generated Even When Disabled (Template Not Pushed to Gateway)
Steps to Verify Configuration Push:
Login to the Gateway
Access PostgreSQL Database:
ruser@005056ACDA10:~$ psql -U vistara
Password for user vistara: *******
psql (10.21 (Ubuntu 10.21-0ubuntu0.18.04.1))
Type "help" for help.
vistara=>
- Run the Query to Fetch Template Configuration:
vistara=> select * from mon_conf_data_pojo where uuid = 'Device uuid';
Note
The Device UUID can be obtained from the OpsRamp UI.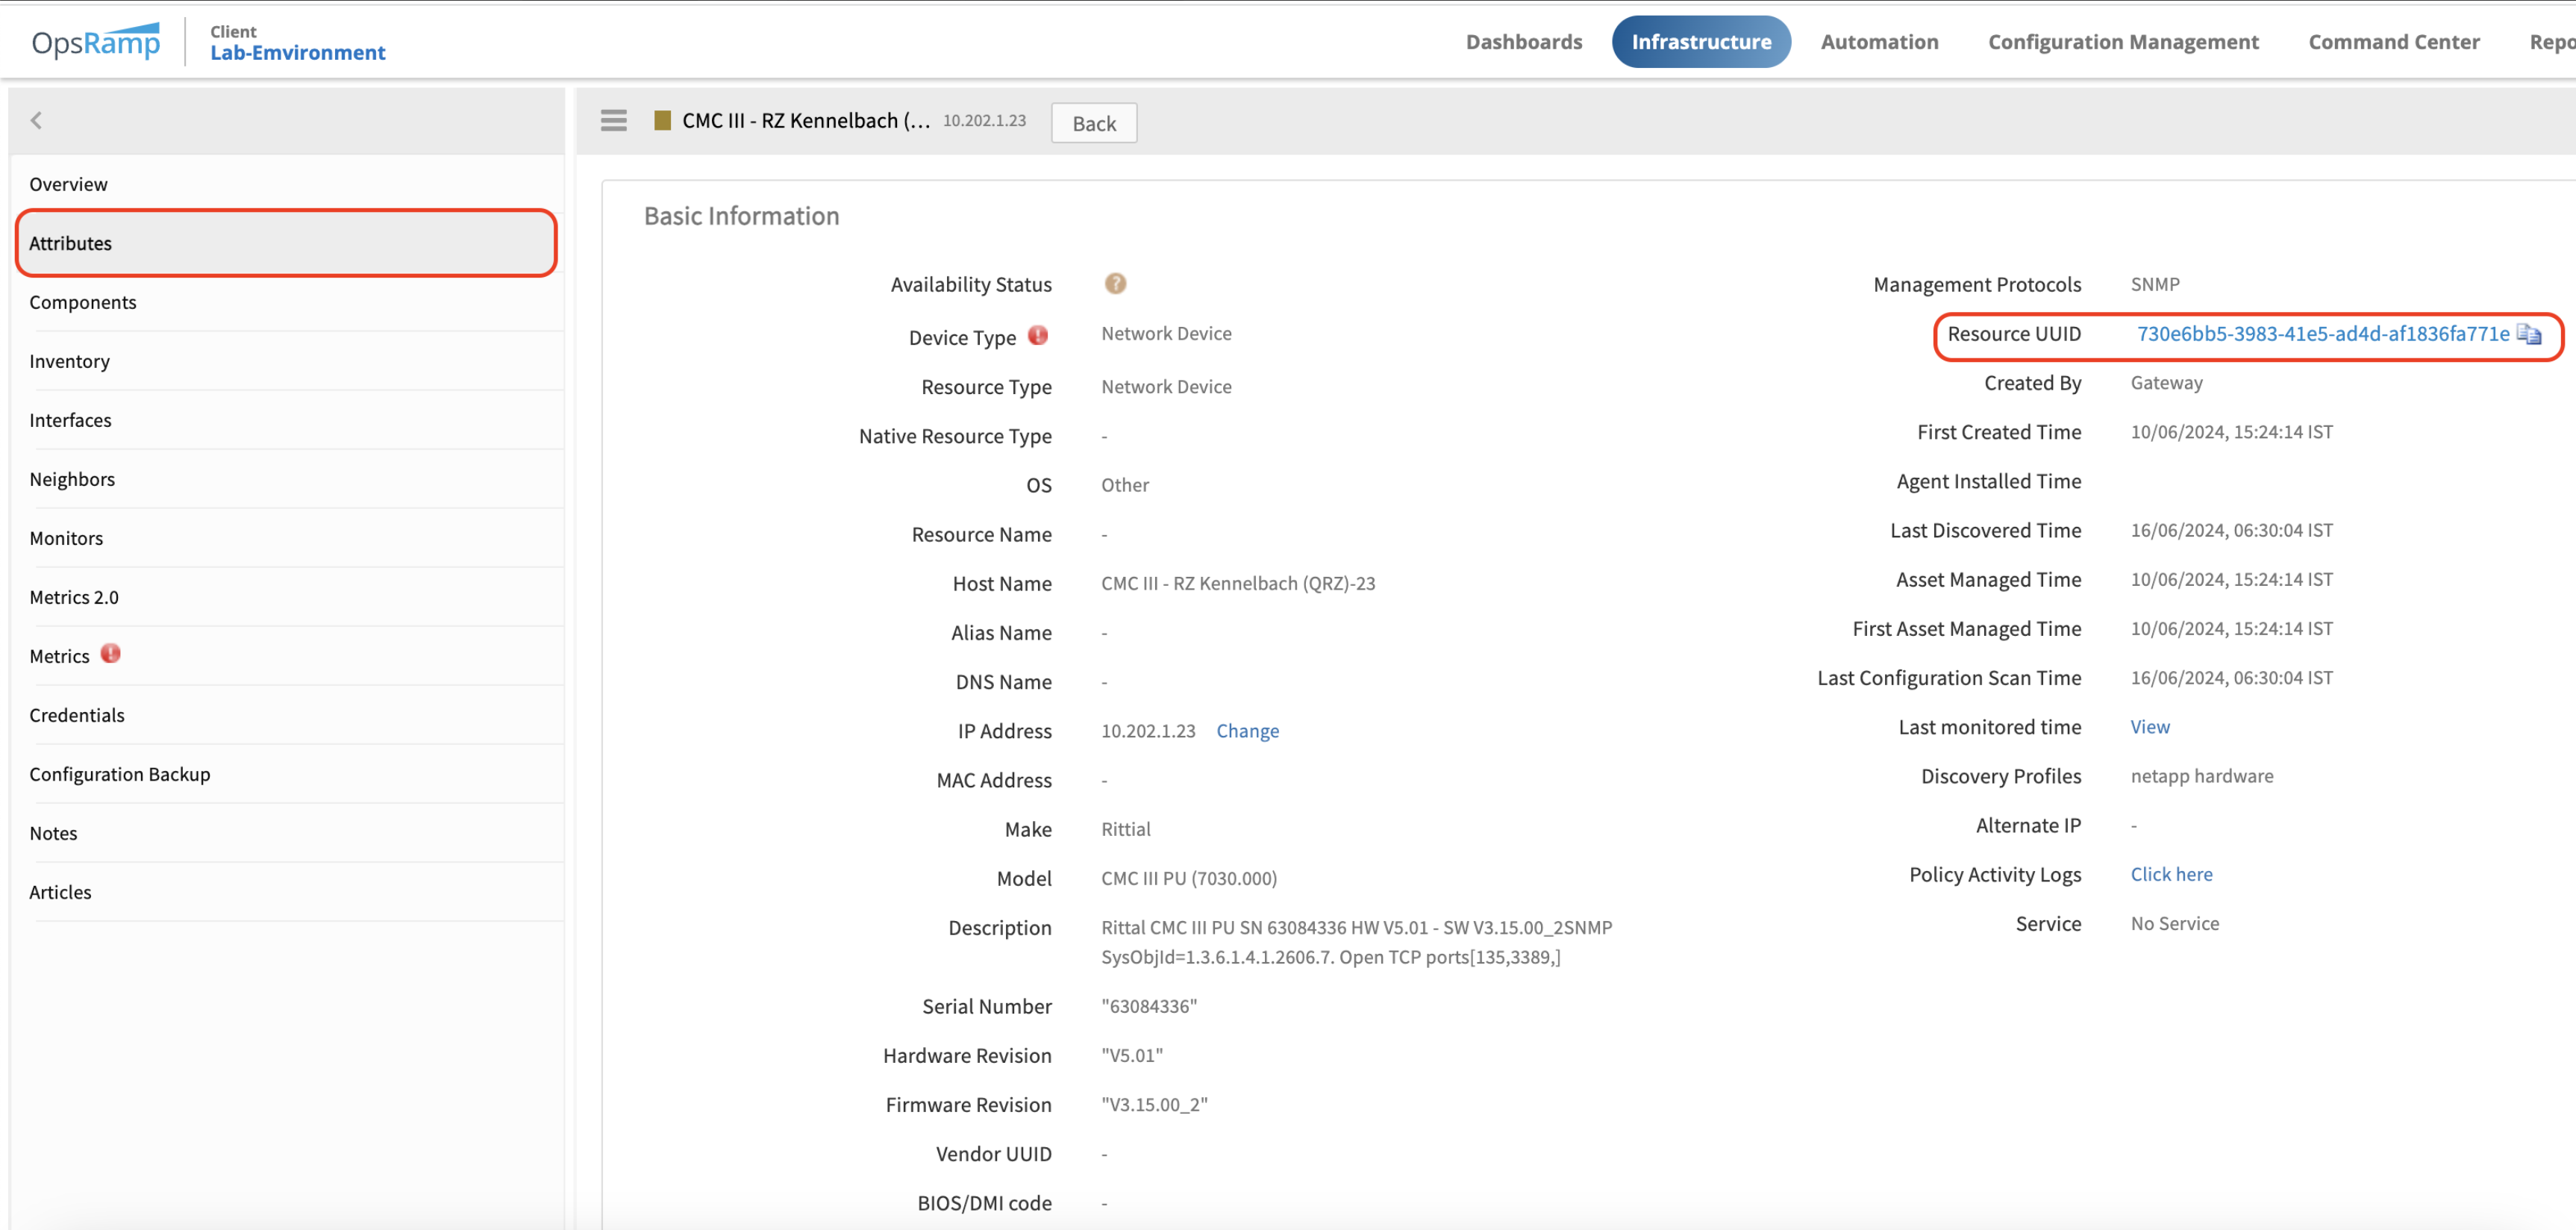
Example:
vistara=> select * from mon_conf_data_pojo where uuid = '730e6bb5-3983-41e5-ad4d-af1836fa771e';
- Validation:
- Review the query output to confirm whether the template configuration has been pushed to the gateway.
- Verify whether alerting is enabled or disabled in the configuration.
Use Case 27: Plot Graphs for String Values
To plot graphs for state or status metrics returning string values, use an Enumerated Map. Configure this at the metric level by setting Datapoint Value Conversion to “Enumerated Map”.