Overview
OpsRamp Copilot is an AI-powered assistant designed to help you search, analyze, and act on operational data in OpsRamp more effectively. It uses context-aware intelligence to assist with monitoring, troubleshooting, and automation—directly within your IT operations workflows.
Getting Started
Accessing OpsRamp Copilot
- Log in to your OpsRamp portal.
- Navigate to the feature section that supports Copilot (for example: Search, Command Center (Alerts), Dashboard, or Integrations).
- Click Copilot icon to open the Copilot panel.
Key Features
1. Channel Dropdown for Targeted Context
Copilot now includes a Channel dropdown that lets you select the specific operational context before entering your query. Available channels:
- Search – Ask Copilot to find documentation or configuration steps.
- Command Center (Alerts) – Works with active alerts; must be opened from Command Center first.
- Dashboard – Creates, modifies, or queries dashboard widgets.
- Integrations – Retrieves and manages integration details.
2. Conversation Breadcrumbs
At the top left of the Copilot window, you will find a breadcrumb navigation bar that:
- Saves all past conversations in your current session.
- Displays previous prompts and their responses.
- Lets you click and revisit earlier queries without retyping them.
Using OpsRamp Copilot
Step 1 – Select a Channel
- Launch Copilot.
- Open the Channel dropdown.
- Select the channel relevant to your task.
- (If using Command Center) — Open an alert first, then launch Copilot to automatically set the alert context.
Step 2 – Enter a Query or Prompt
You can type natural language questions or specific instructions.
Examples by Channel
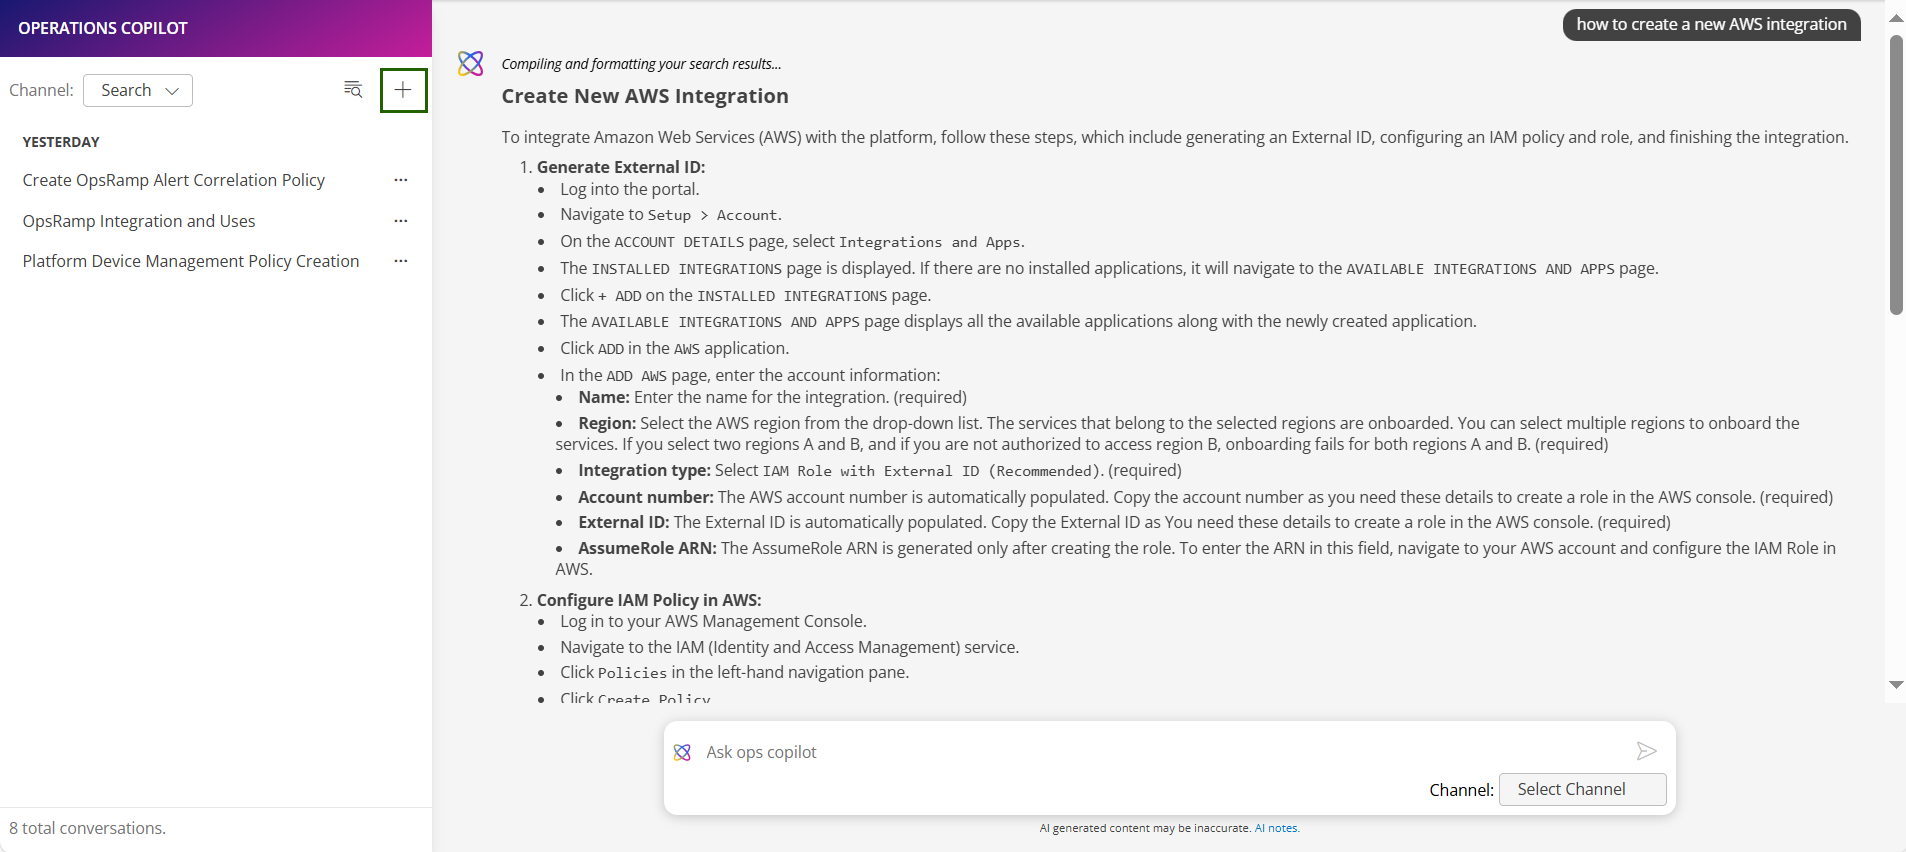
Search Channel — How It Works
Use the Search channel to quickly find relevant documentation from the OpsRamp documentation portal.
Steps:
- Open Copilot.
- From the channel list, select Search.
- In the Copilot input box, type your question. For example:
How do I set up AWS integration? - Copilot searches the documentation portal and returns relevant articles with direct links.
- Click a link to open the article in a new tab for detailed instructions.
Note
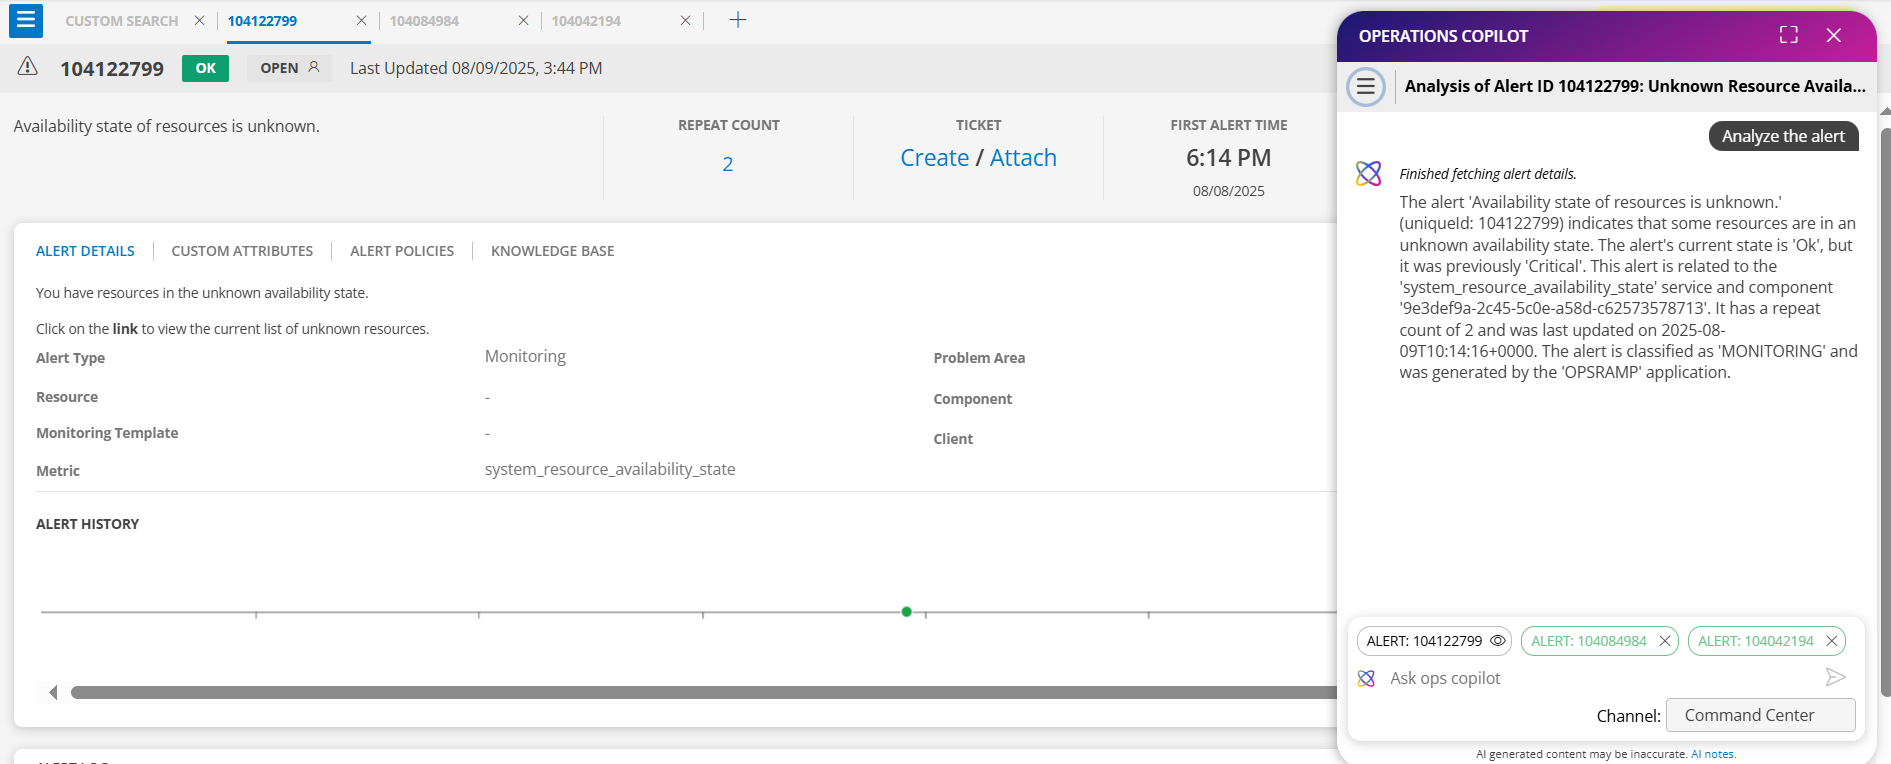
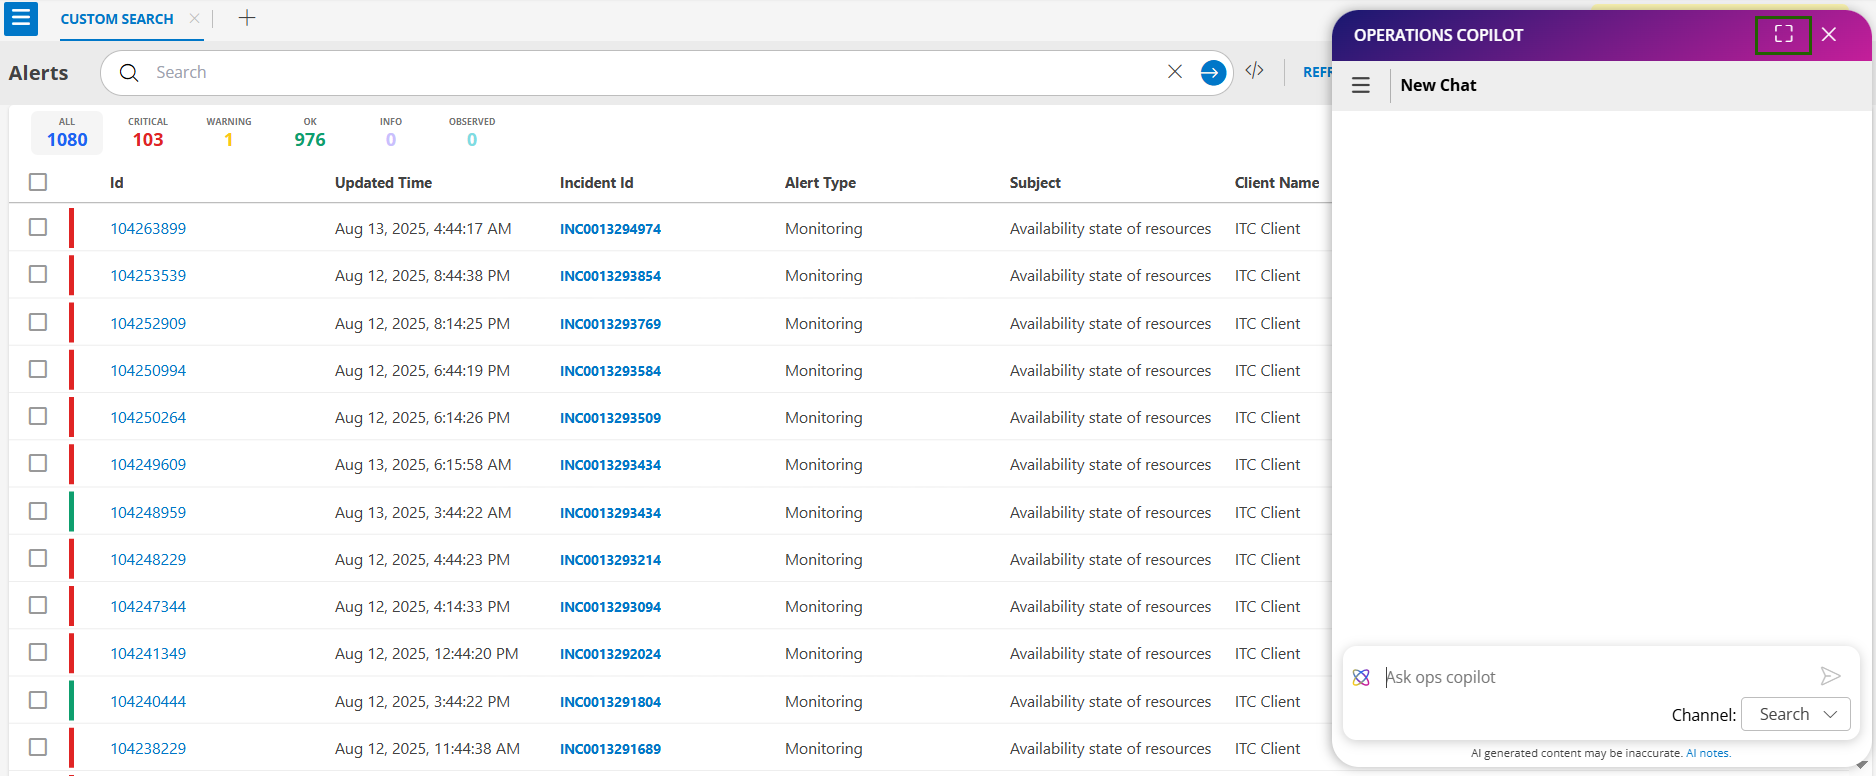
Use specific keywords for more accurate results.Command Center (Alerts) — Copilot Queries
Use Copilot in the Command Center (Alerts) to monitor alerts, analyze issues, correlate related alerts, and take action.
How Copilot Works in Alerts
- Navigate to Command Center > Alerts.
- Open any alert.
- Opening an alert sets it as the active alert context.
- Open Copilot.
- Type your query in natural language.
Example query:
Summarize the alert
Find Impacted Resources and Create Inference
Use Copilot to identify resources generating the most alerts and group them.
Queries:
- Which is the resource that is most affected in last 2 hours?
- Get all the alerts on this resource
- Correlate those alerts

Alert Monitoring and Triage
Use Copilot to view alerts by severity, type, and time.
Queries:
- Show me all critical alerts from the last 24 hours
- What are the open monitoring alerts?
- Get me all trace alerts that are currently in WARNING state
- Show me inference alerts created in the last week
- Find all CRITICAL and WARNING alerts from the past 3 days
- Get all critical alerts from the past 2 hours

Alert Investigation and Analysis
Use Copilot to understand why an alert was triggered.
Queries:
- Analyze the alert
- Get details of alert 12345678
- Analyze alert 87654321 and show me its visualization data
- What metrics triggered alert 11223344?
- Show me the trace query for alert 99887766

Find Related or Similar Alerts
Use Copilot to identify alerts with similar characteristics.
Queries:
- Find similar alerts to 12345678
- Are there other alerts affecting the same resource as alert 45678901?
- Show me alerts with similar patterns to alert 23456789
- Show me alerts with the same metric as this alert from the last 4 hours
- List the alerts from the last 4 hours for the same resource as this alert

Correlate Alerts and Root Cause Analysis
Group related alerts to identify the underlying issue.
Queries:
- Correlate alerts 12345678, 23456789, 34567890 to find relationships
- What alerts are correlated with alert 45678901?
- Show me the correlation policy for inference ID 123
- Get all alerts correlated under inference ID 45690
- Correlate the alerts and acknowledge it as I’m working on fixing the memory issue

View Correlated Alerts and Metric Graphs
View alerts grouped under an inference and see metric behavior at alert time.
Queries:
- What are the correlated alerts of this inference
- Show me the correlated alerts for this inference
- Get the related alerts linked to this inference

Alert Actions and Remediation
Take action on alerts directly from Copilot.
Queries:
- Acknowledge this alert since I’m working on it
- Suppress alert 34567890 for 120 minutes because Scheduled maintenance
- Suppress this alert permanently so I can ignore it
- Close alert 56789012 as the issue is resolved
- Heal alert 78901234 – system recovered automatically
- UnAcknowledge alert 90123456 – needs further review
- UnSuppress alert 01234567 – maintenance completed early

Alert Analytics and Trends
Analyze alert statistics over time.
Queries:
- Count alerts by alert type from last month
- How many alerts per component in the last 2 weeks?
- Give me alert statistics grouped by resource and current state
- What’s the trend of critical alerts over the past 30 days?
- What’s the trend of critical alerts over the past 90 days?

Complete Alert and Ticket Analysis
Get a full understanding of an alert along with ticket details.
Query:Alert 12345678 just fired. Give me a complete analysis – what’s the alert about, are there similar alerts, what tickets were created for it, and suggest how to resolve it based on past resolutions.

Command Center (Tickets) — Copilot Queries
Use Copilot in the Command Center (Tickets) to analyze, track, and resolve tickets.
Ticket Monitoring and Queries
Use Copilot to view and filter tickets by status, priority, and type.
Queries:
- Show me all open incidents
- Get high priority tickets assigned to me
- Show tickets of type Incident, Problem and ServiceRequest
- Find all New and Pending tickets from last week
- Show me tickets in On Hold status

Ticket Investigation and Details
Use Copilot to retrieve detailed ticket information and context.
Queries:
- Get details of ticket INC12345678
- Show me information for tickets INC111, SRQ222, CHG333
- What’s the full context of problem ticket PRB456789?
- Get detailed information on change request CHG987654

Ticket Assignment and Ownership
Use Copilot to view ticket assignments and ownership.
Queries:
- What incidents are currently unassigned?
- Give me the top users to whom the tickets are assigned
- Tickets assigned to JM_User Ab New from the last 30 days

Ticket Analysis and Resolution
Use Copilot to analyze tickets and get resolution suggestions.
Queries:
- Analyze the ticket
- Summarize the ticket
- Help me in suggesting how to resolve this ticket
- Analyze the ticket and resolve it

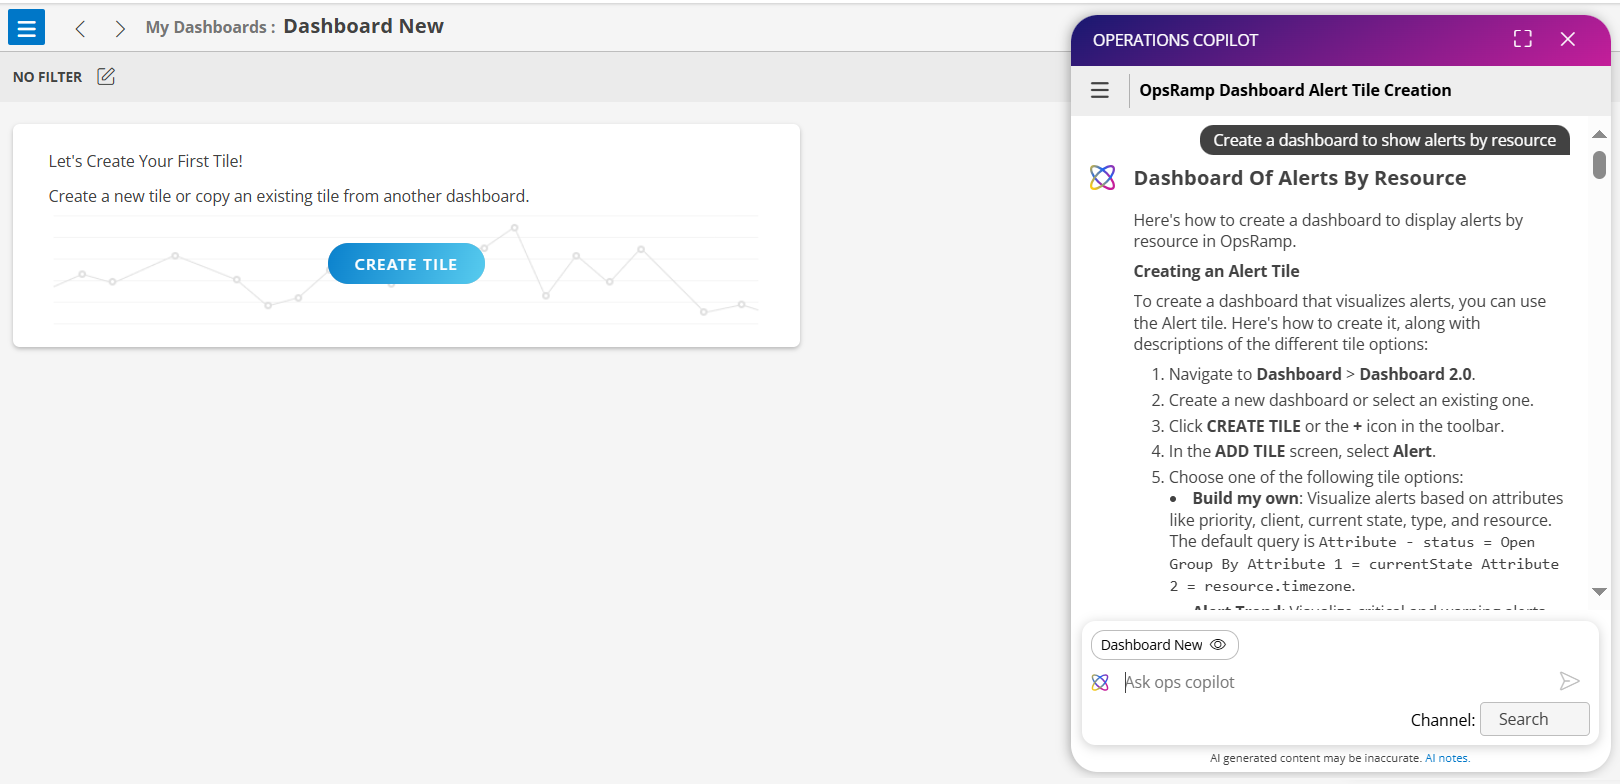
Dashboard Channel — How It Works
Use this channel to create or modify dashboard widgets using Copilot.
Steps:
- Select Dashboards > Dashboard in the portal.
- Open Copilot.
The channel is auto-selected as Dashboards. - In the input box, describe the widget or dashboard you want to create. For example:
Create a memory utilization widget for all servers.
- Copilot confirms widget creation or provides guidance if more details are needed.
Example Queries
- Show me active resources and alerts, and how they are distributed by type.
- Create a dashboard to monitor and categorize Azure resources by type, group, and availability.
- Show a dashboard that tracks Linux resource counts, OS types, and agent versions.
Integrations Channel — How It Works
Use this channel to get information about your connected integrations.
Steps:
Open Copilot.
From the channel list, select Integrations.
Type your request in the input box. For example:
List all connected AWS accounts.Copilot returns a detailed list of connected integrations, including account names and status.
Using Full Screen Mode in Copilot
You can expand the Copilot window to full screen for better visibility and focus.
Steps to Enter Full Screen Mode
Open Copilot.
In the top-right corner of the Copilot window, click the Full Screen icon.
The Copilot interface will now occupy the entire browser window, making it easier to view detailed responses and navigate conversations.
Switching Channels in Full Screen Mode
When you are in full screen mode and actively searching or interacting in a channel, you cannot directly switch to another channel from the current view.
To Switch Channels:
Click the New Conversation (+) icon in the top-left corner of the Copilot window.
Select the desired channel from the available options.
Continue your queries or actions in the new channel.